Figures & data
Figure 1. Study flowchart and annual number of transcatheter (TAVR) and surgical aortic valve replacement (SAVR) along the study period.
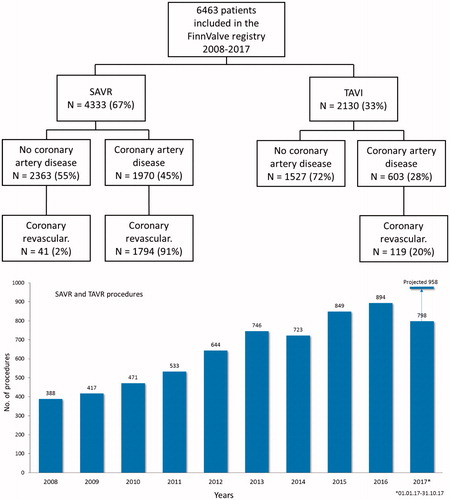
Figure 2. Frequencies of transcatheter (TAVR) and surgical aortic valve replacement (SAVR) along the study period.
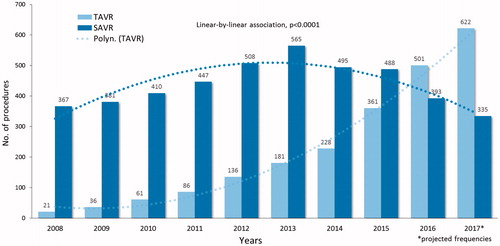
Table 1. Characteristics of patients who underwent transcatheter or surgical aortic valve replacement.
Figure 3. Operative risk stratified by the Society of Thoracic Surgeons (STS) score in patients who underwent transcatheter (TAVR) or surgical aortic valve replacement (SAVR) along the study period.
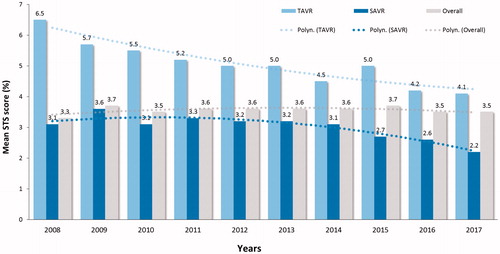
Figure 4. Observed and predicted 30-day mortality by the Society of Thoracic Surgeons (STS) score in patients who underwent transcatheter (TAVR) or surgical aortic valve replacement (SAVR) along the study period. P-values are from the linear-by-linear association test.
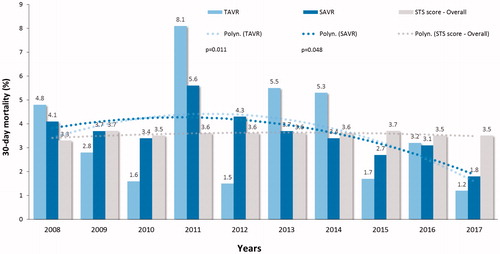
Figure 5. Two years survival in patients who underwent transcatheter (TAVR) or surgical aortic valve replacement (SAVR) from 2018 to 2015. p-Values are from the linear-by-linear association test.
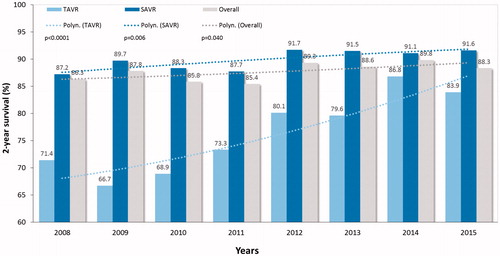
Table 2. Crude rates of adverse events occurred during the index hospitalization in patients undergoing transcatheter or surgical aortic valve replacement.
Figure 6. Incidence of stroke, moderate-to-severe paravalvular regurgitation, acute kidney injury stage 3 and length of hospital stay after transcatheter (TAVR) and surgical aortic valve replacement (SAVR) along the study period. P-values are from the linear-by-linear association test.
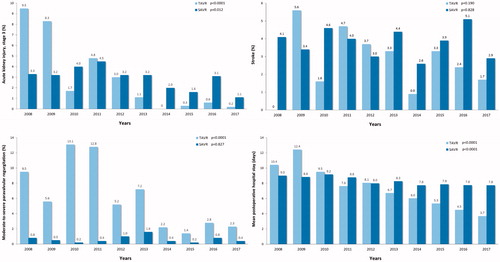
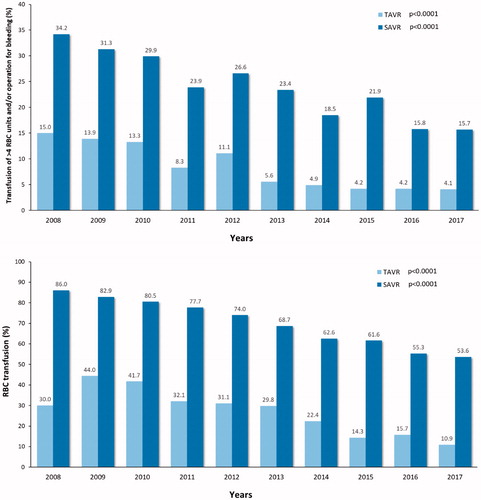
Figure 7. Rates of red blood cell (RBC) transfusion and of transfusion of >4 units of RBC and/or operation for excessive bleeding in patients who underwent transcatheter (TAVR) or surgical aortic valve replacement (SAVR). P-values are from the linear-by-linear association test.