Figures & data
Figure 1. The ScREEN (Sex category, Renal function, ECG/QRSwidth, Ejection fraction and NYHA class) score is strongly associated with CRT response.
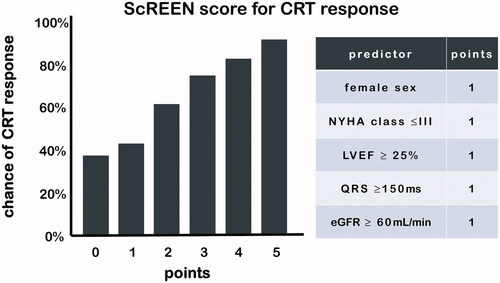
Figure 2. ECG belt and ECGi technologies are shown. The patient wears the ECG belt or ECGi vest and electroanatomical maps can be created for electrical substrate analysis. A: anterior view. P: posterior view.
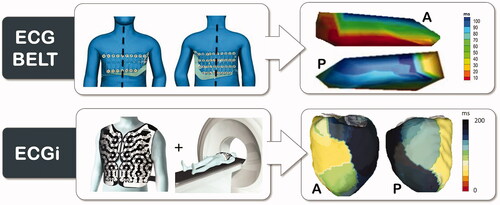
Figure 3. Typical ECGi activation maps during RV apex pacing (left panel) and left bundle branch block (right panel). While total activation time and QRS width were similar, RV apex pacing was associated with much lower VEU and more apex-to-base activation.
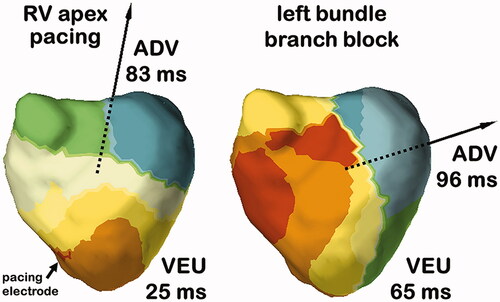
Figure 4. Acute hemodynamic response during biventricular pacing at 3–7 LV sites. Intra-patient variability (red band) is lower than inter patient variability (black double arrow).
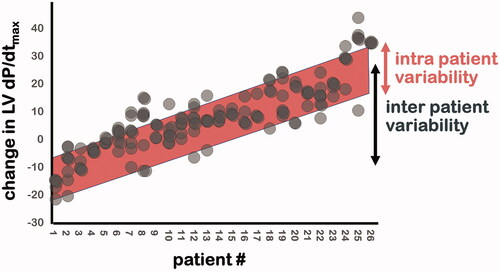
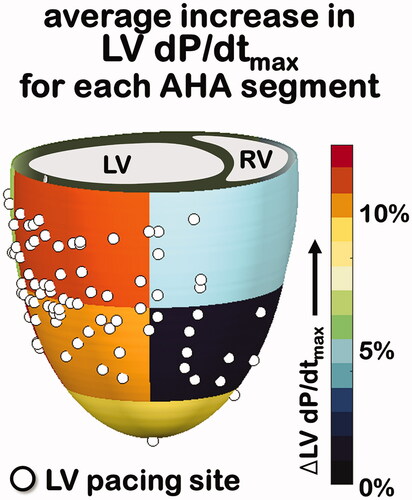
Figure 5. Percent LV dP/dtmax increase for all 104 LV pacing sites (shown as white dots) were averaged according to AHA segment of the LV. AHA: American Heart Association.