
Figures & data
Table 1. Distribution of cardiovascular health metrics among participants and based on cardiovascular mortality.
Table 2. Baseline characteristics and outcomes of the participants.
Figure 1. Dose–response curve of hazard ratio for cardiovascular disease mortality against cardiovascular health score. Restricted cubic spline functions were analysed with knots located at 5th, 35th 65th and 95th percentiles of cardiovascular health score distribution, with the referecne category set at 3; adjusted for age; alcohol consumption; socioeconomic status; high-density lipoprotein chlesterol; use of cholesterol lowering medications, use of antihypertensives, history of coronary heart disease and history of type 2 diabetes mellitus. The dashed lines represent the 95% confidence intervals. CVD, cardiovascular diseased; CVH, cardiovascular health.
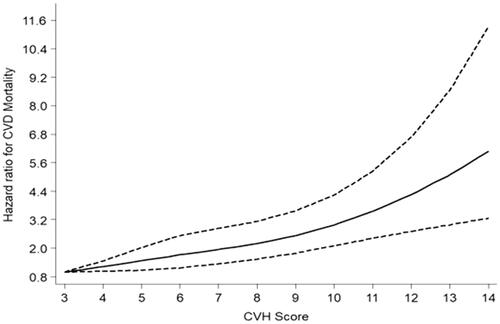
Table 3. Associations between cardiovascular health score and risk of cardiovascular mortality.