
Figures & data
Figure 1. Flow chart of this prospective cohort study. SUA: serum uric acid.
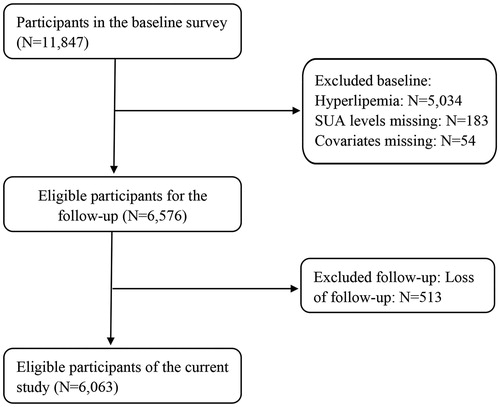
Table 1. Baseline characteristics of participants across sex-specific quartiles of serum uric acid levels.
Figure 2. Dose-response association of serum uric acid levels with hypercholesterolaemia and hypertriglyceridaemia. RRs: risk ratios. The association was adjusted for age (continuous), gender, nationality, education levels, marital status, place of residence, body mass index (continuous), the estimated glomerular filtration rate (continuous), smoking status, drinking status, hypertension and diabetes. The solid line and dashed line represent the estimated RRs and their 95% confidence intervals. (A) and (B) are corresponding to hypercholesterolaemia and hypertriglyceridaemia, respectively.
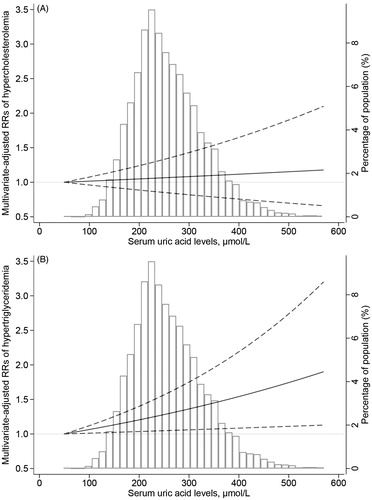
Figure 3. Dose-response association of serum uric acid levels (continuous) with total cholesterol (continuous) and triglyceride (continuous). The association was adjusted for age (continuous), gender, nationality, education levels, marital status, place of residence, body mass index (continuous), the estimated glomerular filtration rate (continuous), smoking status, drinking status, hypertension and diabetes. The solid line and dashed line represent the estimated regression coefficients and their 95% confidence intervals. (A) and (B) are corresponding to total cholesterol (continuous) and triglyceride (continuous), respectively.
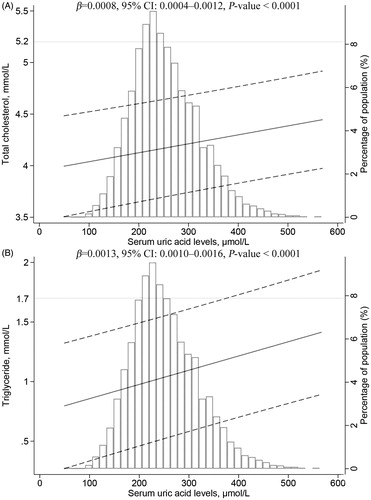
Table 2. Risk ratios (95% confidence intervals) of hypercholesterolaemia and hypertriglyceridaemia according to quartiles of SUA.