
Figures & data
Figure 1. Study flow diagram.
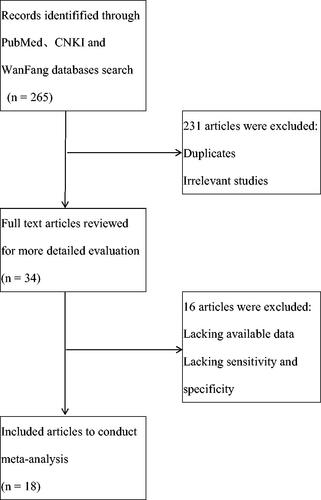
Table 1. Characteristics of included studies in this meta-analysis.
Figure 2. Forest plot of included studies assessing the sensitivity and specificity of circulating miR-21 in CRC.
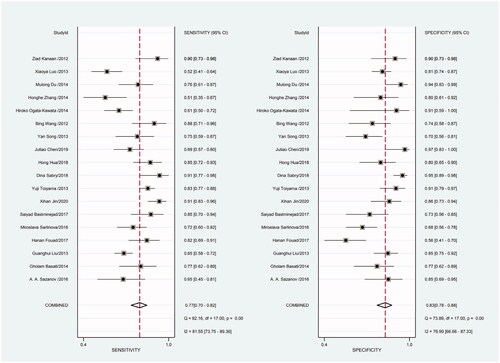
Figure 3. Forest plot of included studies assessing the PLR of circulating miR-21 in CRC.
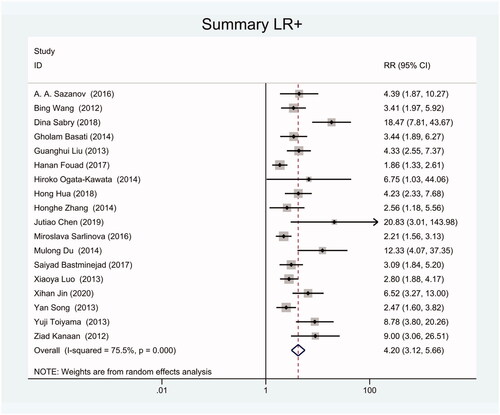
Figure 4. Forest plot of included studies assessing the NLR of circulating miR-21 in CRC.
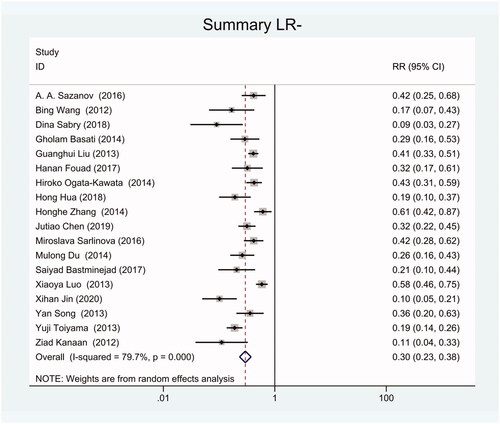
Figure 5. Forest plot of included studies assessing the DOR of circulating miR-21 in CRC.
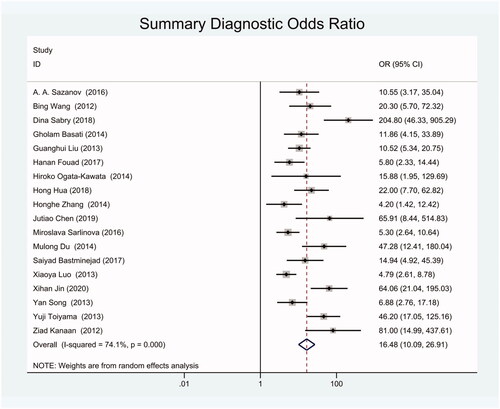
Figure 6. SROC curve for miR-21 in CRC diagnosis.
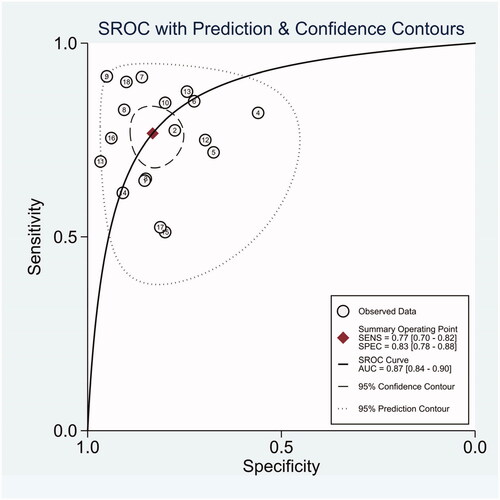
Figure 7. HSROC curve for miR-21 in CRC diagnosis.
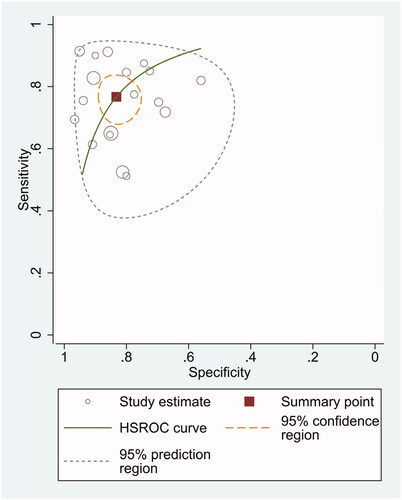
Figure 8. Deeks’ tests for the assessment of publication bias in miR-21 assays.
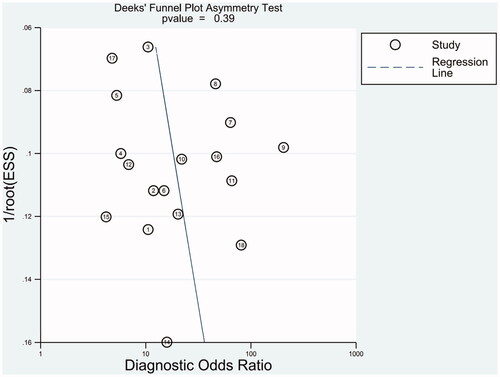
Figure 9. Forest plot of included Chinese studies assessing the sensitivity and specificity of circulating miR-21 in CRC.
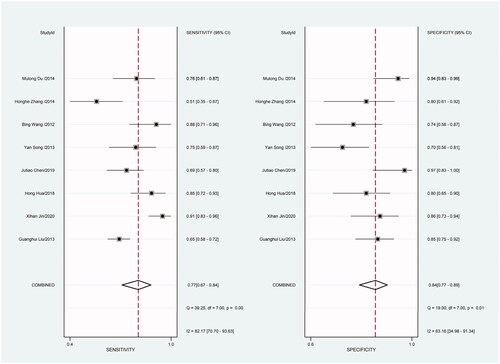
Figure 10. Forest plot of included Chinese studies assessing the PLR of circulating miR-21 in CRC.
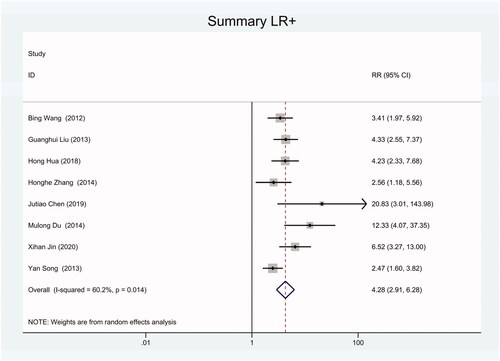
Figure 11. Forest plot of included Chinese studies assessing the NLR of circulating miR-21 in CRC.
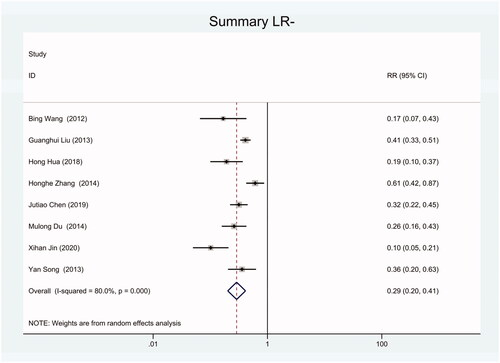
Figure 12. Forest plot of included studies using SYBR-Green qRT-PCR as test method assessing the sensitivity and specificity of circulating miR-21 in CRC.
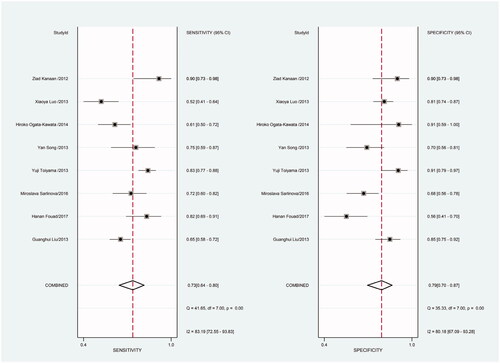
Figure 13. Forest plot of included studies using SYBR-Green qRT-PCR as test method assessing the PLR of circulating miR-21 in CRC.
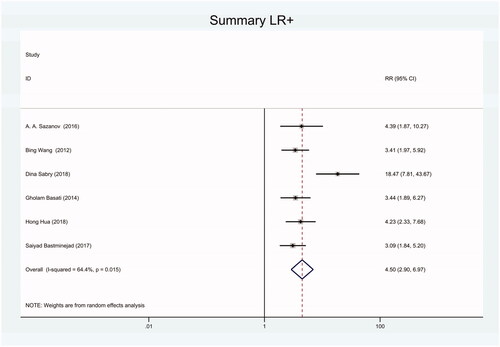
Figure 14. Forest plot of included studies using SYBR-Green qRT-PCR as test method assessing the NLR of circulating miR-21 in CRC.
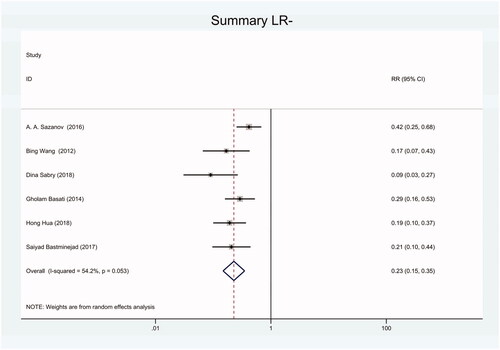
Figure 15. Forest plot of included studies using TaqMan qRT-PCR as test method assessing the sensitivity and specificity of circulating miR-21 in CRC.
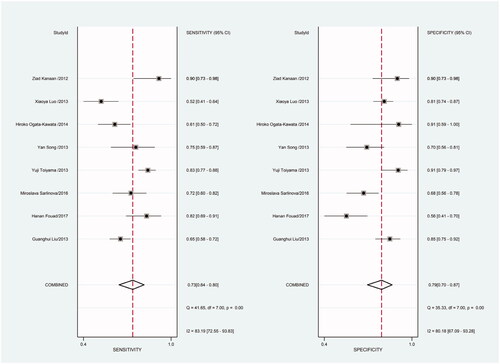
Figure 16. Forest plot of included studies using TaqMan qRT-PCR as test method assessing the PLR of circulating miR-21 in CRC.
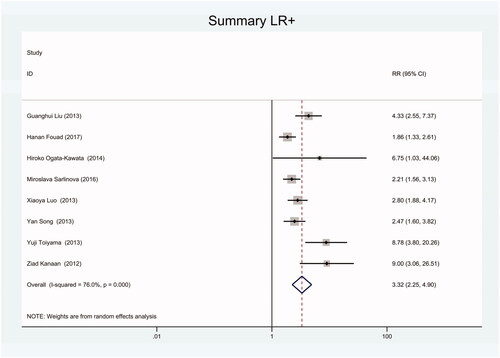
Figure 17. Forest plot of included studies using TaqMan qRT-PCR as test method assessing the NLR of circulating miR-21 in CRC.
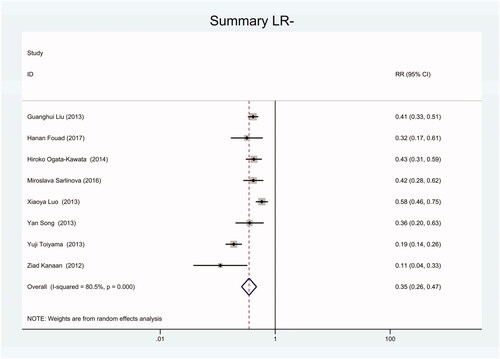
Figure 18. Forest plot of included studies using U6 snRNA as internal reference gene assessing the sensitivity and specificity of circulating miR-21 in CRC.
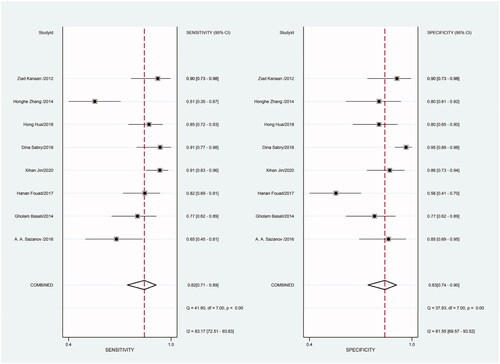
Figure 19. Forest plot of included studies using U6 snRNA as internal reference gene assessing the PLR of circulating miR-21 in CRC.
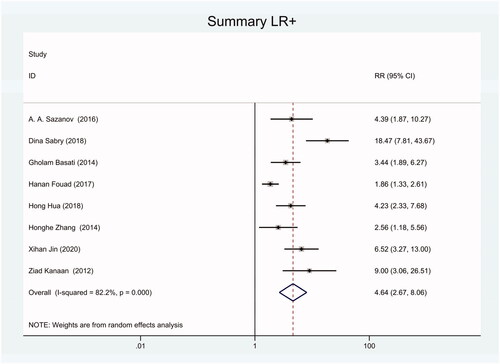
Figure 20. Forest plot of included studies using U6 snRNA as internal reference gene assessing the NLR of circulating miR-21 in CRC.
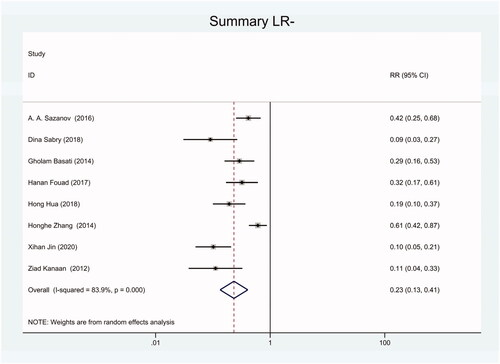
Figure 21. Forest plot of included studies using miR-16 as internal reference gene assessing the sensitivity and specificity of circulating miR-21 in CRC.
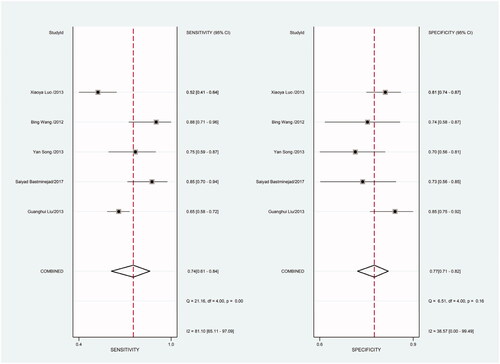
Figure 22. Forest plot of included studies using miR-16 as internal reference gene assessing the PLR of circulating miR-21 in CRC.
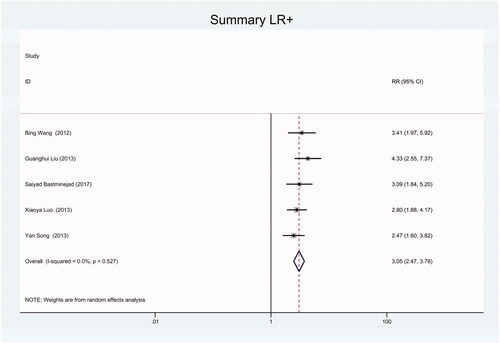
Figure 23. Forest plot of included studies using miR-16 as internal reference gene assessing the NLR of circulating miR-21 in CRC.
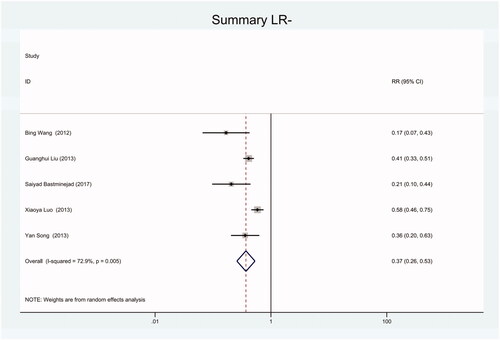
Table 2. Possible sources of heterogeneity of covariants in the meta-regression analysis.