
Figures & data
Figure 1. Patient inclusion flowchart.
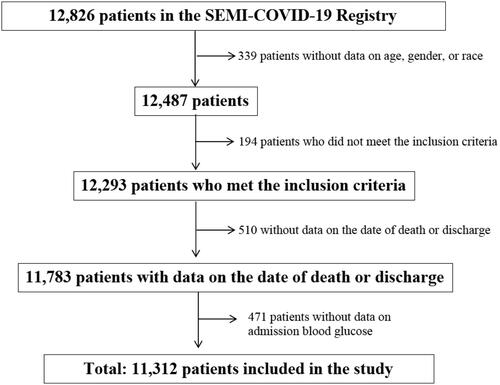
Table 1. Baseline characteristics of SEMI-COVID-19 registry participants, according to admission blood glucose levels.
Figure 2. All-cause mortality (%) during hospitalization according to admission BG groups in all patients and based on the diabetes status, p value <.0001 (A). Kaplan–Meier’s curves according to admission BG levels in all patients (B) and in patients with diabetes (C) and without diabetes (D). BG <140 mg/dL (upper line), BG 140–180 mg/dL (middle line) and BG >180 mg/dL (lower line). Log rank p<.0001 for all curves.
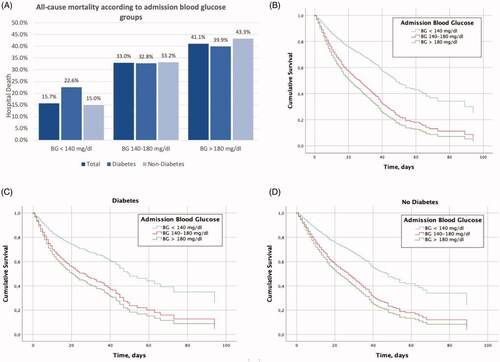
Table 2. Outcomes according to admission blood glucose levels.
Table 3. Association with all-cause in-hospital mortality.
Table 4. Association with composite outcome (death, mechanical ventilation and/or ICU admission).
Data availability statement
The steering committee of the Spanish SEMI-COVID-19 Registry will consider reasonable requests for the sharing of data. Requests should be made to the corresponding author.