
Figures & data
Figure 1. Enrolment and Follow-up. 1,436 patients were assessed for eligibility, of whom 419 were deemed eligible for enrolment and all enrolled in group 1 to 3 (Research group, 348; Control group, 71), including cases that suffered a combined event within 1 year during follow-up. And this study specifies the longest follow-up period is 5 years. *M0E0S0T0C0 according to the Oxford classification of IgAN. S, segmental glomerular sclerosis. S < 25%, the proportion of segmental glomerular sclerosis <25%. S ≥ 25%, the proportion of segmental glomerular sclerosis ≥25%. MN: membranousnephropathy. DKD: diabetic kidney disease.
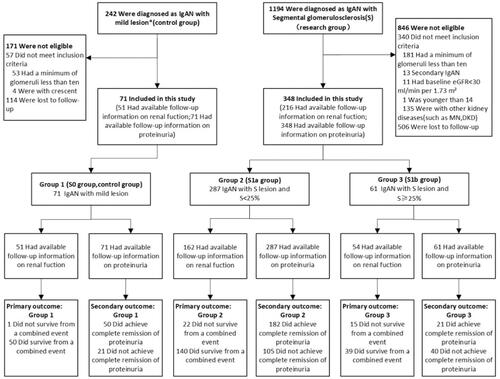
Table 1. Baseline and follow-up characteristics of IgAN patients enrolled.
Figure 2. ROC curves of the optimal cut-off of proportion of S lesion in IgAN. AUC: area under curve. CI: confidence interval.
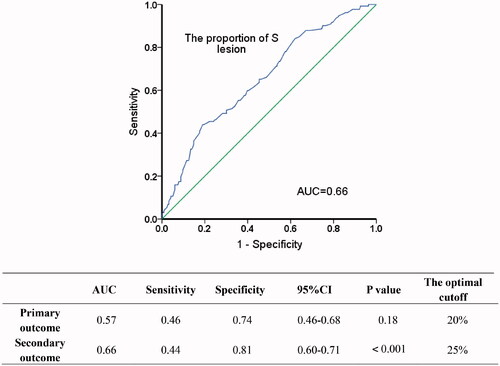
Table 2. Correlations between S lesion ≥ 25% and clinic pathological features in IgAN patients: univariate and multivariate Logistic regression analysis.
Figure 3. Associations between the subclassification of S lesion and endpoint events (survival from a combined event and complete remission of proteinuria) in IgAN patients. (1) Kaplan-Meier Curve for the survival of a combined event (a) and complete remission rate of proteinuria (b). a. S0, S1a > S1b: The survival from a combined event for S1b group was significantly lower than S0 group (p = .005) and S1a group (p = .03). b. S0, S1a > S1b: The complete remission rate of proteinuria for S0 group (p < .001) and S1a group (p = .01) were significantly higher than S1b group. (2) Cox regression model for survival of a combined event (c) and complete remission rate of proteinuria (d). c. S0, S1a > S1b: The survival from a combined event for S1b group was significantly lower than S0 group (HR = 0.08, p = .03) and S1a group (HR = 0.37, p = .02) (Adjusted for M scores and the proportions of global sclerosis). d. S0, S1a > S1b: The complete remission rate of proteinuria for S0 group (HR = 2.85, p = .001) and S1a group (HR = 1.94, p = .02) were significantly higher than S1b group (Adjusted for initial eGFR and blood triglyceride).
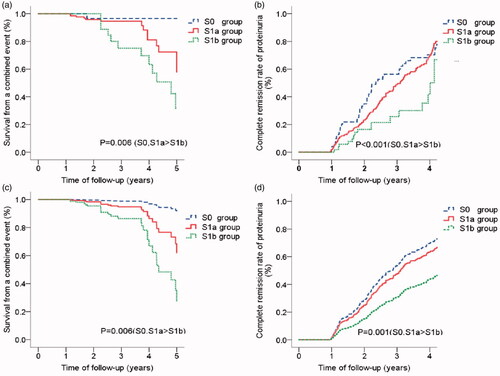
Table 3. Differences in renal outcomes between patients with S lesion given immunosuppression or not given immunosuppression.
Table 4. Differences in renal outcomes between patients with S lesion in varying degrees of global sclerosis.
Supplemental Material
Download ()Data availability statement
The data underlying this article were provided by the Second Xiangya Hospital by permission. Data will be shared on request to the corresponding author with permission of the Second Xiangya Hospital.