
Figures & data
Figure 1. Selecting and identification of significantly prognostic proteins based on machine-learning algorithm in proteomics. (A) Volcano plot indicated the significantly prognostic proteins with high-risk (marked in red) and low-risk (marked in green). (B and C) Lasso Cox regression analysis was applied to further restrict the fit with prognostic values to obtain integrated prognosis-related proteins.
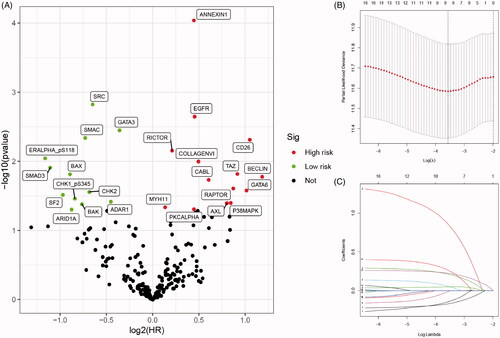
Table 1. Kaplan–Meier analysis and univariate Cox regression analysis of differential expressed proteins (both p-value < 0.05).
Figure 2. Survival analysis indicated significantly prognostic role of BECLIN, EGFR, PKCALPHA, ANNEXIN1, AXL, SRC proteins expression. (A–E) High expression of BECLIN, EGFR, PKCALPHA, ANNEXIN1 and AXL significantly correlated with worse outcomes in BCa patients (p < .05). (F) Down-regulated of SRC was markedly related with poor prognosis (p < .001).
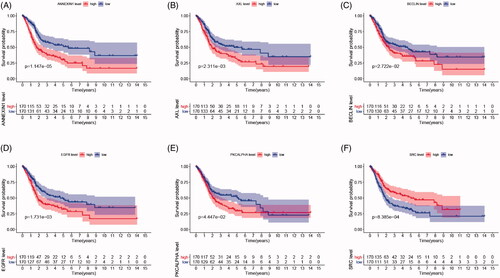
Figure 3. Differential expression of integrated prognosis-related proteins (IPRPs) and construction of the prediction model. (A) Expression of each IPRPs in high- and low-risk BCa groups. (B) Survival analysis showed strong power of IPRPs model to predict prognosis that high-risk BCa patients had significantly worse prognosis comparing to low-risk group (p < 0.001). (C and D) Increased risk score responded to shorter survival cases.
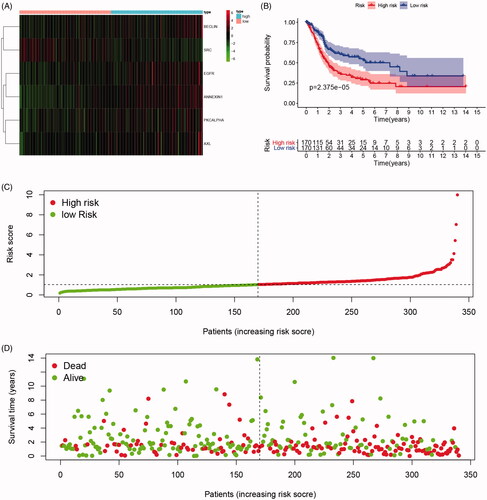
Figure 4. Cox regression and ROC analysis indicated significantly and independently prognostic role of IPRPs model. (A and B) Forest plot displayed that the risk score of IPRPs model significantly predicts survival for BCa patients in univariate (p < .001, HR = 1.597) and multivariate (p < .001, HR = 1.442) Cox regression analysis, respectively. (C) ROC curves showed the predictive ability of each independent factor, and the risk score exhibited a good prognostic value with AUC = 0.714. (D) Sankey diagram showed the association between various types of proteins and IPRPs.
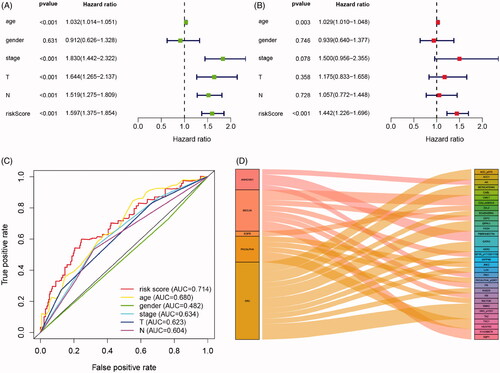
Figure 5. Genomic prognostic validation of significant proteins in multiply datasets. (A) Proteome expression of EGFR, PKCALPHA, ANNEXIN1, AXL and SRC were positively correlated with corresponding mRNA expression. (B–F) Survival analyses were performed in GEO and TCGA cohorts respectively, and the results indicated that low PRKCA (protein named PKCALPHA) expression was significantly correlated with OS in GSE13507 cohort (p = .006). (G-K) In larger sample TCGA cohort, high expression of EGFR, ANXA1 (protein named ANNEXIN1), AXL and low expression of SRC were markedly related with poor outcomes, which is consistent with results of proteomics (p < .05).
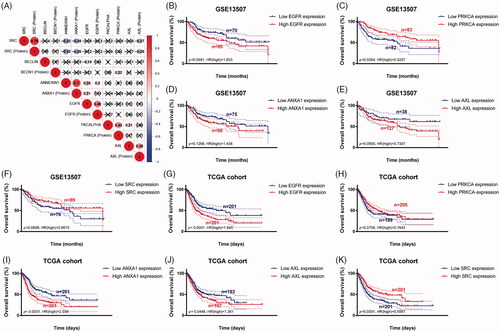
Figure 6. Significant involved genes and hallmarks pathways of IPRPs model in BCa obtained from GSEA functional enrichment analysis. (A) Top 100 significant genes positively and negatively correlated with risk score of IPRPs model were performed in a heat map. (B–G) The most involved significant pathways included ATP synthesis coupled electron transport, respiratory electron transport chain, oxidative phosphorylation, mitochondrial respiratory chain complex assembly, respirasome and fatty acid beta oxidation. (H) The protein-protein interaction network of differential expressed genes was constructed and visualize. (I) Functional enrichment analyses of hub genes were performed and visualized in bubble chart. Significant genes were enriched in G-protein coupled receptor signalling pathway, locomotion, taxis and chemokine signalling pathways (p < .0001).
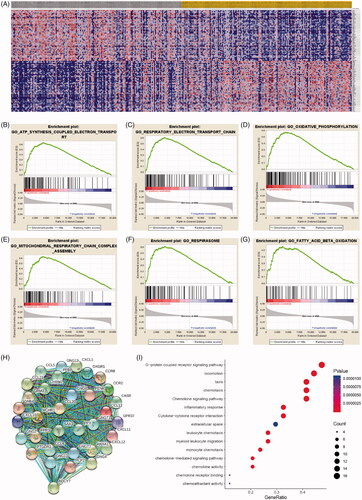
Figure 7. SRC correlate with immune cell infiltrations pan-cancers microenvironment and negatively correlated with expression levels of immune check-point molecular in BCa. (A-B) Spearman correlations between SRC and immunoinhibitors and abundance of tumour-infiltrating lymphocytes (TILs) across human cancers were applied. SRC expression were negatively correlated with immunoinhibitors expression and abundance of TILs in BCa. (C) SRC expression showed significantly positive associated with tumour purity (cor.=0.334), and negative association with CD8+ T cell (cor.= −0.182) and dendritic cell infiltration (cor.= −0.357). (D–G) Spearman’ test suggested that SRC expression significantly correlated with decreased abundance of activated CD8+ T cells (r= −0.328), activated dendritic cells (r= −0.442), immature dendritic cells (r= −0.142) and plasmacytoid dendritic cells (r= −0.302). (H–K) Spearman’ test suggested that SRC expression significantly correlated PDCD1 (r= −0.362), PDCD1LG2 (r= −0.555), LAG3 (r= −0.474) and TIGIT (r= −0.391). (L) Spearman’s correlation tests indicated that SRC significantly showed negative correlation with immune check-point molecular expressions, which differs from other cancers.
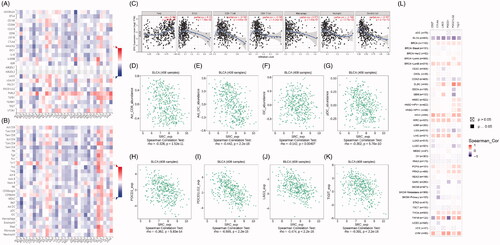
Table 2. GO and KEGG pathways enrichment analysis of hub genes.
Figure 8. Prognostic implications of SRC expression in cancers in its subgroup survival analysis of BCa. (A) Prognostic role of SRC in cancers, with significance marked in solid. (B) Survival analysis showed significantly prognostic role of SRC in TCGA-BLCA cohort (p < .001, HR = 0.55). (C and D) Decreased SRC expression significantly correlated poorer outcomes in male (p < 0.001, HR = 0.45), while have no significant association with prognosis in female BCa patients (p = 0.2). (E and F) Decreased SRC expression significantly correlated poorer outcomes in both high (HR = 0.44) and low (HR = 0.52) tumour mutation burden. (G–J) Decreased SRC expression significantly correlated poorer outcomes in CD8+ T cells infiltration enriched (HR = 0.57) and decreased (HR = 0.57) subgroups, and B cells infiltration enriched (HR = 0.56) and decreased (HR = 0.46) subgroups. (K and L) Decreased SRC expression significantly correlated poorer outcomes in mesenchymal stem cells enriched (HR = 0.61) and, especially, decreased (HR = 0.34) subgroups. (M and N) Decreased SRC expression significantly correlated poorer outcomes in while (HR = 0.60) and black African or American (HR = 0.29) subgroups.
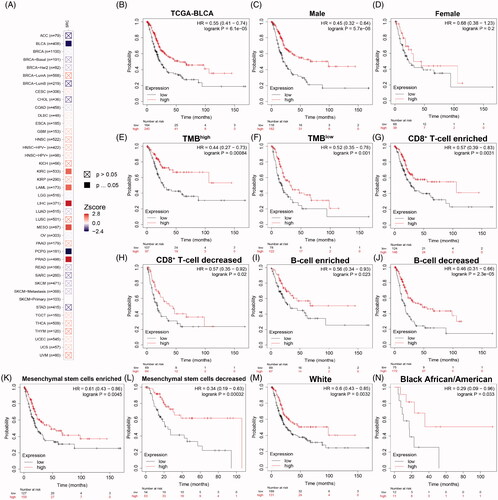
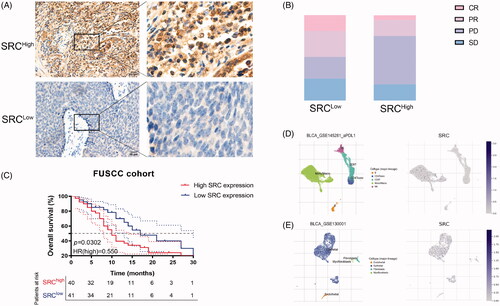
Figure 9. SRC protein expression significantly predicts immunotherapy responses for 81 BCa patients from FUSCC cohort. (A) Immunohistochemistry was performed and SRC was mainly stained in plasma membrane and cytosol. (B) Elevated SRC protein expression significantly correlated with poorer survival in 81 BCa patients receiving ICT. (C) There are 32% PR (n = 14), 18% CR (n = 8), 25% SD (n = 11) and 25% PD (n = 11) cases in low SRC expression subgroup, and 19% PR (n = 7), 5% CR (n = 2), 19% SD (n = 7) and 57% PD (n = 21) cases in high SRC expression subgroup. (D and E) The single-sequencing dataset GSE145281 and 130001 suggested localization and binding targets of SRC mainly in monocyte/macrophages and epithelial cells.
Supplemental Material
Download ()Data availability statement
The datasets used and/or analyzed during the current study are available from the corresponding author on reasonable request or online database.