
Figures & data
Figure 1. The pathological pathway of cervical dizziness between cervical structures and vestibulospinal nucleus. Pathway 1: originating from mechanoreceptors in the facet joint; pathway 2: originating from muscle spindles; pathway 3: originating from mechanoreceptors in intradiscal endings.
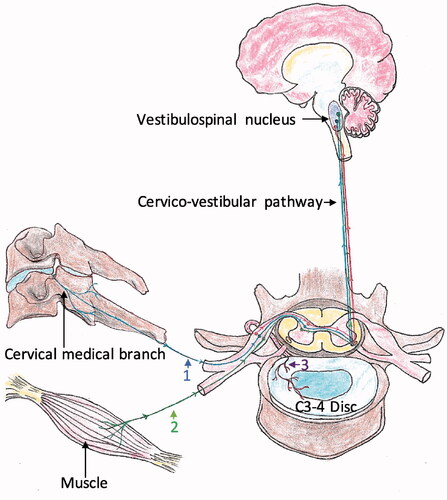
Figure 2. Three distinct ablation regions in the degenerative disc. (a) Mechanoreceptors innervate from annulus into nucleus, 1-plot indicates the margin of annulus, 2-plot indicates the boundary between annulus and nucleus, and 3-plot indicates the mid-nucleus; (b–d) Ablation region is in the margin of the annulus, the boundary between annulus and nucleus, and the mid-nucleus, respectively; (e–g) In C4–5 level, the ablation region is in the margin of the annulus, the boundary between annulus and nucleus, and the mid-nucleus under fluoroscopic guidance, respectively.
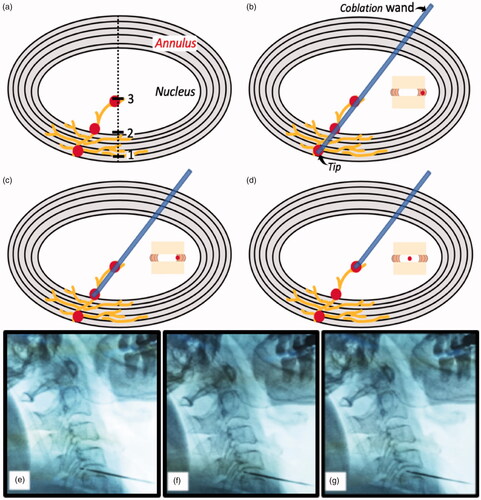
Table 1. Inclusion criteria for cervicogenic dizziness.
Table 2. Demographic data of patients in CGD.
Figure 3. The efficacy outcomes after coblationdiscoplasty in 12 months follow-up. (a) Comparison of CDG VAS between two groups; (b) Comparison of neck pain VAS between two groups; (c) Comparison of CGD frequency score between two groups; (d) Comparison of CGD alleviation rating between two groups. B: baseline; P: post-operative; w: week; m: month; “__” indicates medium; “--->” indicates 25th quartile; “–>” indicates 75th quartile.
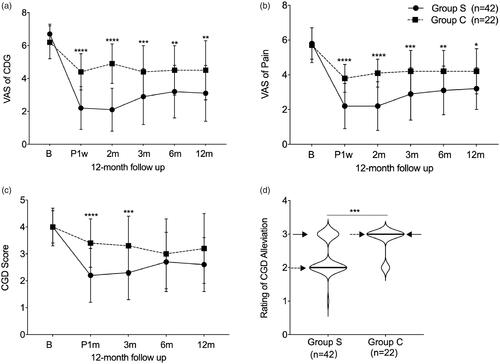
Table 3. Comparison of CGD VAS, neck pain VAS and CGD score between two groups in 12-month follow-up.