Figures & data
Figure 1. The immune subtypes in oesophageal cancer. (A) The CDF curve in TCGA-ESCA cohort samples. (B) The CDF Delta area curve of TCGA-ESCA cohort sample. (C) The clustering heat map when consensus k = 3. (D) The prognosis value of the three subtypes visualized by K–M curve in TCGA-ESCA cohort. The distribution of the three immune subtypes based on T stage (E), N stage (F), TNM stage (G) and tumour grade (H) in TCGA-ESCA cohort. (I) The prognosis value of the three subtypes visualized by K–M curve in GSE63524 cohort. The distribution of the three immune subtypes based on T stage (J), N stage (K), TNM stage (L) and tumour grade (M) in GSE63524 cohort. The statistical significance of the distribution difference between groups are calculated by the –log10 (p value).
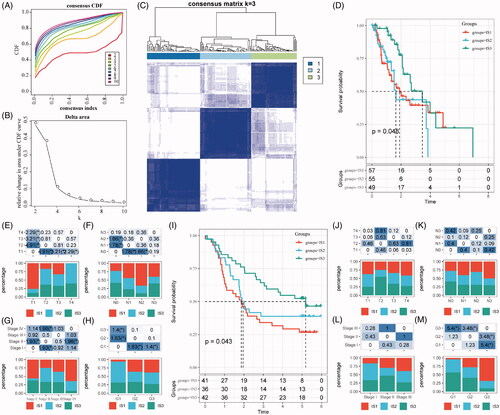
Figure 2. The immune subtypes are associated with TMB in oesophageal cancer. (A) The distribution of TMB in the three immune subtypes. (B) The distribution of the number of gene mutations in the three immune subtypes; the p value is determined by the rank sum test. (C) The characteristics of the top 10 mutation genes in each subtype.
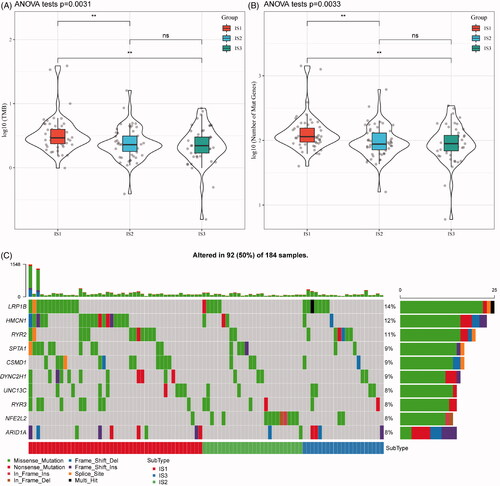
Figure 3. The immune subtypes are associated with immune biomarkers. (A) The expression of classic markers for chemotherapy-induced immune responses in the TCGA-ESCA cohort. (B) The expression of classic markers for chemotherapy-induced immune responses in the GSE53624 cohort. (C) Expression of immune checkpoint genes in the TCGA-ESCA cohort. (D) Expression of immune checkpoint genes in the GSE53624 cohort. The significance is statistically tested by variance analysis.
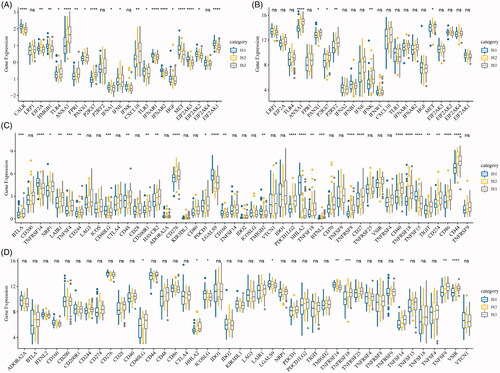
Figure 4. The immune subtypes are associated with biomarkers of oesophagus cancer. (A) SCC expression in each immune subtype (TCGA-ESCA). (B) Cyfra21-1 expression in each immune subtype (TCGA-ESCA). (C) SCC expression in each immune subtype (GSE53624). (D) The expression of Cyfra21-1 in each immune subtype (GSE53624).
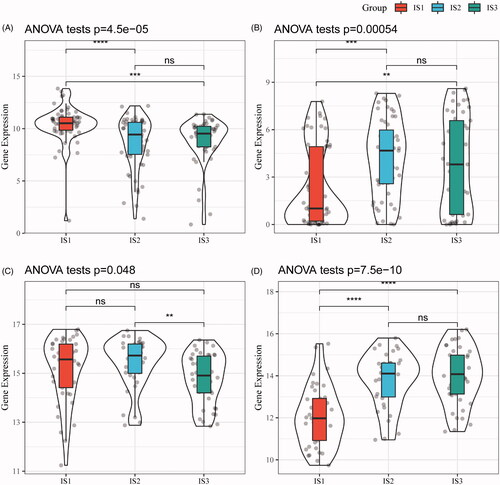
Figure 5. The distribution of immune subtypes in immune subpopulations. (A) The 28 immune cell enrichment score of the immune subtypes (TCGA-ESCA). (B) The enrichment score of immune cells associated with the prognosis of good and poor subtypes (TCGA-ESCA). (C) The 28 immune cell enrichment score of the immune subtypes (GSE53624). (D) The enrichment score of immune cells associated with the prognosis of good and poor subtypes (GSE53624). (E) The intersection of our three immune subtypes and previous reported molecular subtypes. (F) The distribution of three immune subtypes in 22 immune-related characteristics with significant difference (FDR < 0.05).
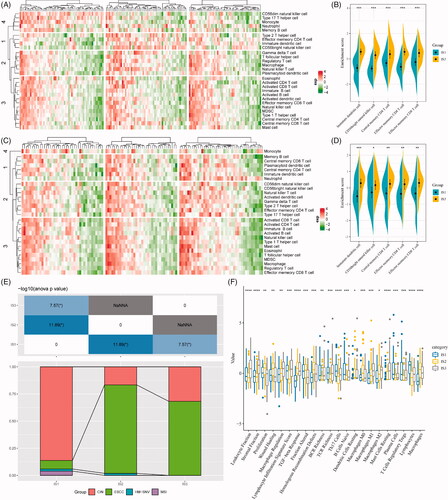
Figure 6. The immune landscape of oesophageal cancer. (A) The immune landscape of oesophageal cancer based on immune subtypes. (B) The correlation maps of 28 immune cell subgroups and two principal components in the immune landscape. (C) The immune landscape of oesophageal cancer based on intra-class heterogeneity of immunophenotyping. (D) The distribution of intra-class immune subtypes in immune cell subgroups. (E) The immune landscape of oesophagus based on immune subtypes with prognostic value. (F) The prognostic difference based on the locations of samples in the immune landscape of oesophageal cancer.
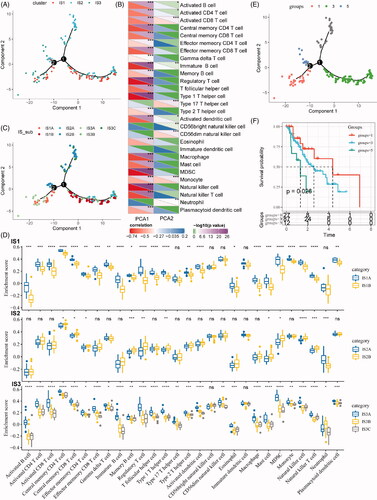
Figure 7. Identification of immune gene co-expression modules. (A) The cluster analysis visualized be dendrogram; analysis of network topology by scale independence (B) and mean connectivity (C). (D) The cluster dendrogram for module visualization in colours. (E) The number of gene in each module. (F) The distribution of each module in immune subtypes. (G) The correlations between co-expressed modules and clinical features as well as immune molecular subtypes.
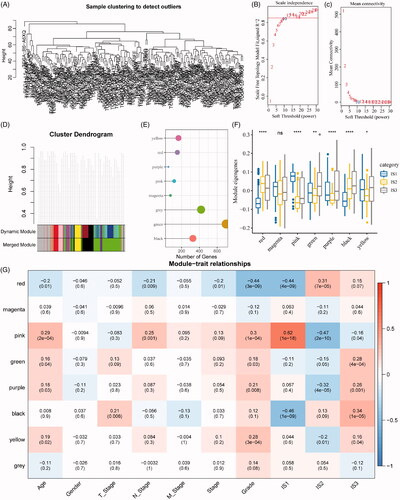
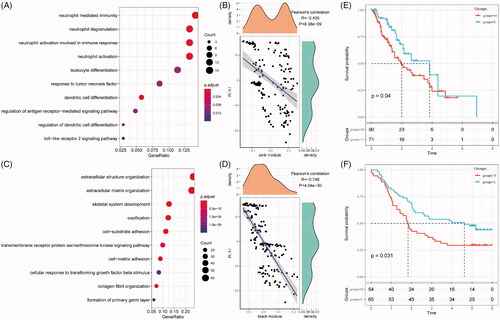
Figure 8. Function and prognosis analysis of immune gene co-expression module. (A) Gene enrichment analysis of pink module. (B) Correlation between the pink module and the first principal component in immune landscape. (C) Gene enrichment analysis of black module. (D) Correlation between the black module and the first principal component in immune landscape. The KM survival curve for grouping patients based on the expression of signature genes selected in the pink and black modules in TCGA-ESCA cohort (E) and GSE53624 cohort (F).