
Figures & data
Figure 1. Identification macrophages marker genes by single cell sequence analysis. (a) PCA plot coloured by various samples. (b) t-SNE plot coloured by various cell types. (c) identification marker genes of different cell types.
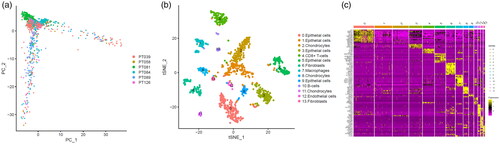
Figure 2. Screen of macrophage marker genes signature. GO analysis (a) and KEGG pathway enrichment (b) of macrophages marker genes were performed to explore the biological function of these marker genes. Macrophages marker genes related risk score model was developed by univariate analysis (c) and multivariate analysis (d) of macrophages marker genes that were associated with overall survival of breast cancer patients in the TCGA database. (e) Dot plot showing the expression of macrophages marker genes included in the risk score model in various cell types. Dot intensity of colour indicates the average expression in a particular cluster and dot size represents the percent of cells expressing the gene in that cluster. Cluster 7 represents macrophages.
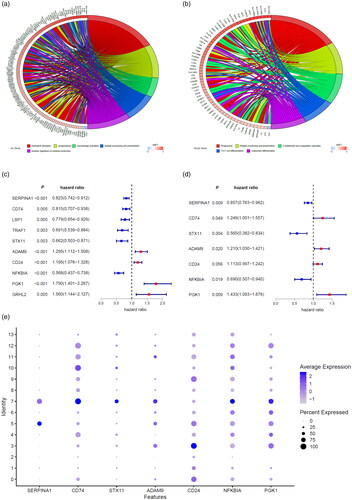
Figure 3. Breast cancer patients’ survival status, risk score distribution and Kaplan–Meier curves of OS in the TCGA database and the GSE96058 validation dataset. (a) Breast cancer patients were separated into high-risk and low-risk groups with the cut-off of risk score generated by X-tile software. (b) Breast cancer patients survival status and risk score distribution in the TCGA database. (c) Kaplan–Meier curves of OS between high-risk and low-risk groups in the TCGA database. (d) Breast cancer patients in the GSE96058 validation set were separated into high-risk and low-risk groups with the same cut-off in the TCGA database. (e) Breast cancer patients survival status and risk score distribution in the GSE96058 validation set. (f) Kaplan–Meier curves of OS between high-risk and low-risk groups in the GSE96058 validation set.
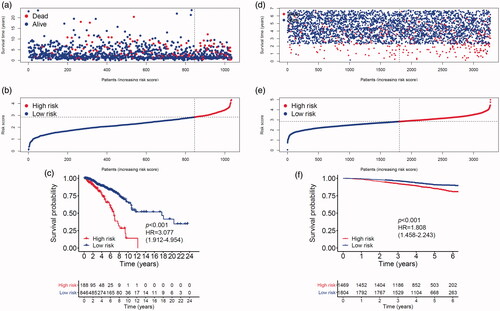
Figure 4. Receiver operating characteristic curves of the MMGS model to predict the 3- and 5-yearOS in the training set (a), validation set (b).
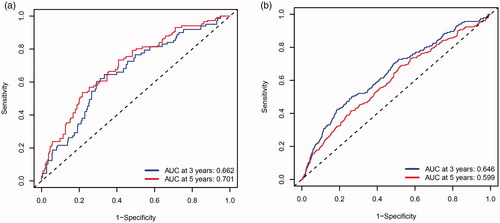
Figure 5. The relation between risk score and age (a), tumour size (b), lymph node status (c), ER status (d), PR status (e), HER2 status (f) of breast cancer patients in the TCGA database.
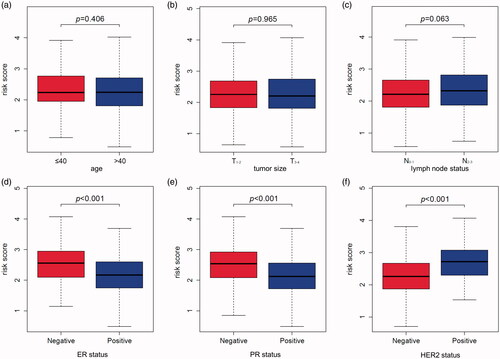
Figure 6. The relation between risk score and age (a), tumour size (b), lymph node status (c), ER status (d), PR status (e), HER2 status (f) of breast cancer patients in the GSE96058 validation dataset.
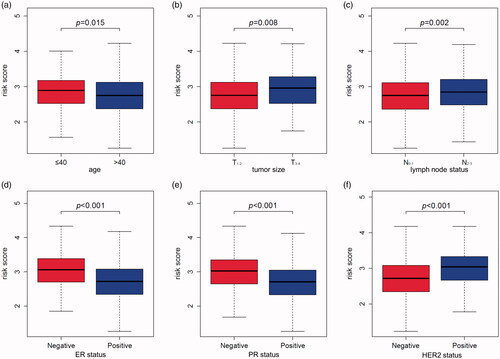
Table 1. Univariate and multivariate analysis of breast cancer in the TCGA database.
Table 2. Univariate and multivariate analysis of breast cancer in the GSE96058 dataset.