
Figures & data
Figure 1. Prostate cancers showed immunosuppression in TCGA cohort. (A) The expression levels of immune-related genes and multigene signatures in tumour and non-tumorous prostate. Patients were ordered by the immune scores of each sample. RFS: recurrence free survival; CD4+ Tcm: central memory CD4 T cell; CD4 + Tem: effector memory CD4 T cell. (B, C) The difference of immune score and stroma score between normal and tumour prostate samples. p Values were computed using Mann-Whitney test (****p < .0001; *p < .05). (D–G) The difference expression of immune cell gene signature in normal and tumour prostate samples. p Values were computed using Mann-Whitney test (***p < .0001; **p < .001). M2-TAMs, M2 subtype tumour associated macrophages.
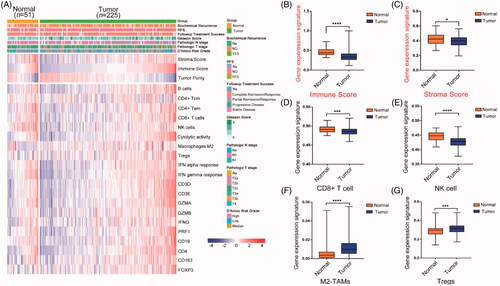
Figure 2. Classification of prostate cancer based on immunosuppression mechanisms. (A) Unsupervised clustering of TCGA cohort (n = 225) prostate cancer by three immune-gene expression signatures (cytolytic activity, M2-TAMs and Tregs); expression levels of marker for T cells (CD4 and CD8A); Tregs (FOXP3); M2-TAMs (CD163 and CD206) and primary immune check points were also shown. (B, C) The differential expression of immune score and stroma score value among three immune subclasses (****p < .0001; *** p < .001; ns: negative significance, Mann-Whitney test). (D–G) The differential proportions of tumour patients classified by clinical characters within three immune subclasses.
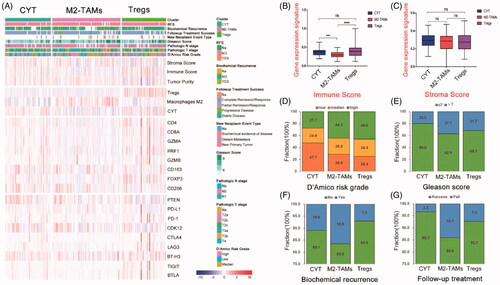
Figure 3. Association between three subtypes and prognosis in PCa in TCGA cohort. (A) Kaplan-Meier analysis of immune subtypes based on five-year recurrence free survival in TCGA cohort. p Value was calculated by the log-rank test among subtypes. (B–D) Kaplan-Meier analyses of tumours stratified by cytolytic activity, M2-TAMs, and Tregs infiltration score. p Value was calculated by the log-rank test.
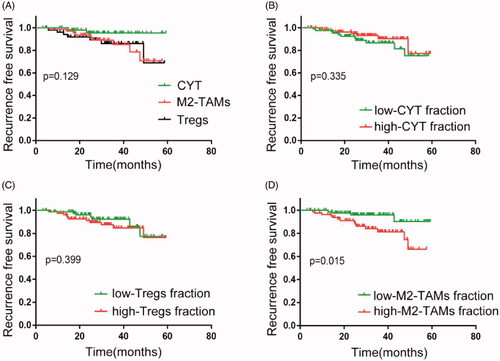
Table 1. Univariate and multivariate cox analysis for predicting RFS in the TCGA cohort.
Figure 4. The immunosuppressive mechanisms of M2-TAMs subclass. (A) The median expression level of the immune-related genes in three subclasses of prostate cancer (Gene list: chemokines and chemokines receptor; interleukins and interleukins receptor; cytokines and cytokines receptor and interferons and interferons receptor). (B, C) Gene expression levels of PD-L1/PD-1 of three immune subclasses in TCGA cohort and GEO cohort prostate cancer samples. p Values were computed using Mann-Whitney test (****p < .0001; ***p < .001; ***p < .001; **p < .01; *p < .05; ns, p > .05). (D) Go analysis plots were shown the hub genes that up-regulated in the M2-TAMs subclass in prostate cancer samples. BP: biological process; CC: cellular component; MF: molecular function. (E) Gene set enrichment plots were shown the up-regulated genes in the M2-TAMs subclass compared to the CYT or Tregs subclass.
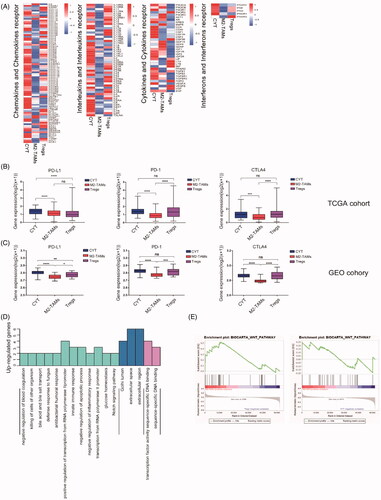
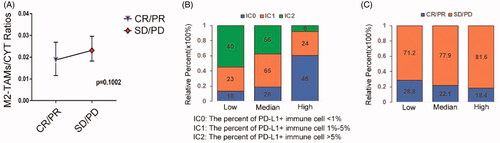
Figure 5. M2-TAMs subclass showed poorly respond to ICIs. (A) The ratios of infiltration fractions of M2-TAMs to CYT value in the effective and ineffective anti-PD-L1 clinical therapy groups of the IMvigor210 cohort patients (n = 298). CR: complete response; PR: partial response; SD: stable response; PD: progress response (p = .1002, Mann-Whitney test; median (95% confidence interval)). (B) The proportions of patients with different PD-L1+ immune cells infiltrating fractions in three groups of low, medium and high M2-TAMs/CYT values (low vs. high: p < .0001; Chi-square test). (C) The proportions of patients with response to PD-L1 blockade therapy in three groups of low, medium and high M2-TAMs/CYT values (low vs. high: p = .136; Chi-square test).
Data availability statement
The authors confirm that the data supporting the findings of this study are available within the article and its supplementary materials.