
Figures & data
Figure 1. TMZ attenuates ischaemic injury in hindlimb of diabetic mice. (A) Representative photographs of hindlimbs from mice with sham surgery (control group, n = 10), untreated mice after FAL (saline group, n = 10), and TMZ-treated mice after FAL (TMZ group, n = 10) were shown; (B) The severity of the lesion in ischaemic hindlimb was estimated according to a five-point scoring system; (C) The foot function score of the ischaemic hindlimb was estimated. Results are expressed as mean ± SEM. *p < .05 compared to the control group, #p < .05 compared to the saline group.
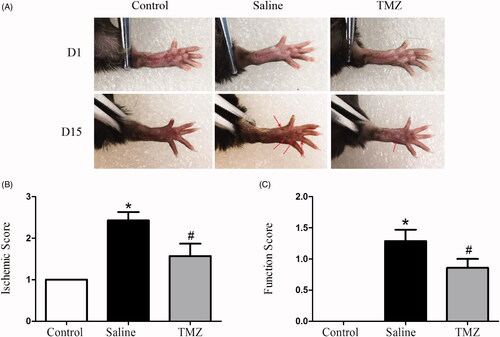
Figure 2. TMZ therapy promotes angiogenesis in the ischaemic hindlimb of diabetic mice. (A) Sections of ischaemic muscles recovered at day 14 post-surgery were stained for CD31 (endothelial stain; red), α-SMA (smooth muscle strain; green), and DAPI (nuclear stain; blue). Representative immunofluorescence of muscle sections were shown (n = 3 sections per mouse, 10 mice per group). Scale bar: 50 μm; (B) Quantitative analysis of capillary density in gastrocnemius muscle was performed. Results are expressed as mean ± SEM. *p < .05 compared to the control group, #p < .05 compared to the saline group.
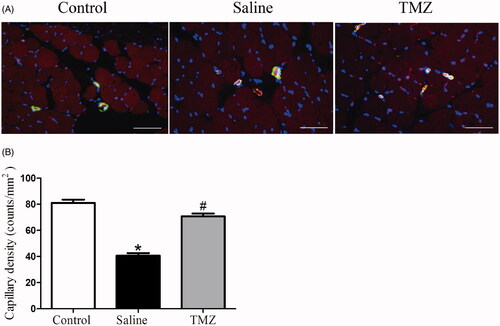
Figure 3. TMZ stimulates VEGF-A expression in the ischaemic muscles and elevates serum ICAM-1 level. (A) Gastrocnemius extracts were assayed for VEGF-A protein levels by immunoblot and quantitation; (B) Serum levels of ICAM-1 were measured by ELISA. Data are shown as means ± SE. *p < .05 compared to the control group, #p < .05 compared to the saline group.
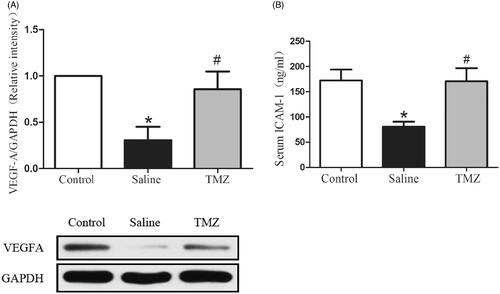
Figure 4. TMZ therapy promotes myofiber regeneration in the ischaemic hindlimb of diabetic mice. (A) Immunofluorescence of muscle sections from TMZ-treated mice with CD31 (endothelial stain; red), α-SMA (smooth muscle stain; green) and DAPI (nuclear stain; blue). Scale bar: 50 μm. White arrows indicate regenerating myofibers, characterized by central nucleus location; (B) Quantification of the percentage of regenerating fibres, characterized by the presence of a centrally located nucleus. Results are expressed as mean ± SEM. #p < .05 compared to the saline group.
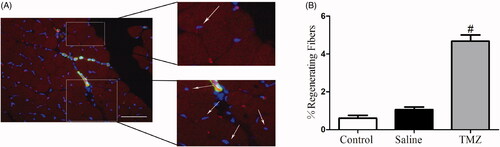
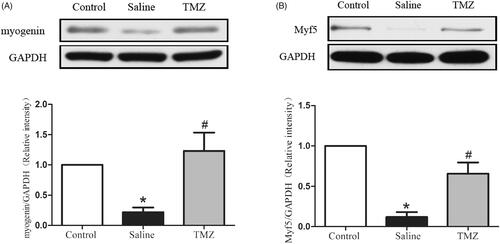
Figure 5. TMZ reverses the changes of myogenic markers in the ischaemic hindlimb of diabetic mice. Immunoblot and quantitation of (A) myogenin and (B) Myf5 were assayed. Data are shown as means ± SE. *p < .05 compared to the control group, #p < .05 compared to the saline group.
Data availability statement
The data supporting the findings of this study are available within the article.