
Figures & data
Table 1. The sequence of primers, siRNAs, shRNAs and miRNAs.
Figure 1. Expression of circ_0010235 was stably elevated in NSCLC tissues and cells. (A, B) qPCR detected circ_0010235 expression (A) in 53 paired NSCLC tumour tissues (tumour) and adjacent normal tissues (adjacent) and (B) in NSCLC cell lines (NCI-H2342, HCC827, NCI-H1299 and A-549) and normal lung cell line (16HBE). (C–F) qPCR detected RNA expression of circ_0010235 and linear ALDH4A1 (C, D) in NCI-H1299 and A-549 cells-derived total RNAs treated with RNase R (RNase R+) and un-treated with RNase R (RNase R–) and (E, F) in NCI-H1299 and A-549 cells treated with ActD during consecutive 18 h. **p< .01 and ***p< .001.
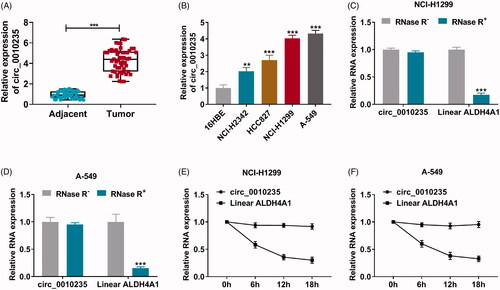
Figure 2. Exhaustion of circ_0010235 curbed proliferation, migration and invasion of NSCLC cells. (A, B) qPCR detected circ_0010235 expression in NCI-H1299 and A-549 cells transfected with si-NC, si-circ_0010235#1 or si-circ_0010235#2. (C–J) In si-NC- and si-circ_0010235#1-transfected NCI-H1299 and A-549 cells, (C, D) CCK-8 assay measured OD value at 450 nm during consecutive 72 h, (E) EdU assay determined EdU positive rate, (F) FCM evaluated apoptotic rate, (G, H) transwell assay confirmed migration rate and invasion rate, and the scale bar was 100 μm in transwell images, (I, J) western blotting detected protein expression of E-cadherin and N-cadherin, normalized to GAPDH. **p< .01 and ***p< .001.
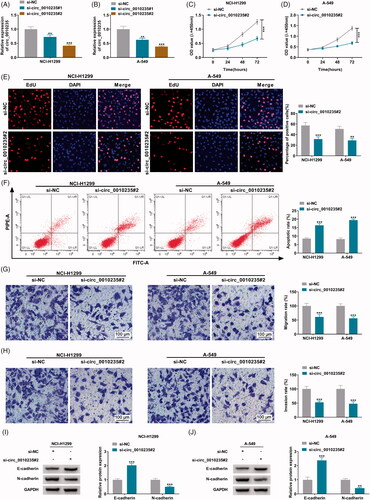
Figure 3. The target relationship between circ_0010235 and miR-338-3p. (A) Venn diagram showed the overlapping miRNAs that were predicted to be responsive to circ_0010235 by CircInteractome, circBank and StarBase software. (B) qPCR detected RNA expression of miR-197-3p, miR-338-3p and miR-433-3p in human tumour (n = 6) and adjacent (n = 6) samples. (C, D) qPCR detected RNA expression of miR-338-3p and miR-433-3p in si-NC- and si-circ_0010235#2-transfected NCI-H1299 and A-549 cells. (E) The miR-338-3p response elements are shown in circ_0010235 WT and MUT according to StarBase. (F, G) Dual-luciferase reporter assay measured luciferase activity of circ_0010235 WT and MUT report vectors in NCI-H1299 and A-549 cells transfected with miR-338-3p or miR-NC. (H, I) RIP assay and qPCR detected RNA enrichment of circ_0010235 and miR-338-3p in anti-IgG- and anti-Ago2-precipitated RNAs in cell extract of NCI-H1299 and A-549 cells. (J, K) qPCR detected miR-338-3p expression in human tumour (n = 53) and adjacent (n = 53) tissues, and in cells (16HBE, NCI-H1299 and A-549). ***p< .001.
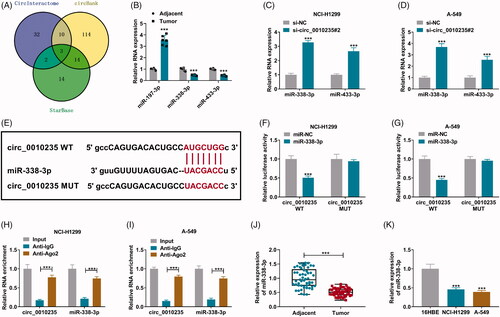
Figure 4. Blockage of miR-338-3p attenuated the effects of circ_0010235 exhaustion in NSCLC cells. (A, B) qPCR detected miR-338-3p expression in in-miR-NC- and in-miR-338-3p-transfected NCI-H1299 and A-549 cells. (C–N) In NCI-H1299 and A-549 cells transfected with si-NC, si-circ_0010235#2 or si-circ_0010235#2 along with in-miR-NC or in-miR-338-3p, (C, D) CCK-8 assay measured OD value at 450 nm during consecutive 72 h, (E, F) EdU assay determined EdU positive rate, (G, H) FCM evaluated apoptotic rate, (I–L) transwell assay confirmed migration rate and invasion rate, and the scale bar was 100 μm in transwell images and (M, N) western blotting detected protein expression of E-cadherin and N-cadherin, normalized to GAPDH. **p< .01 and ***p< .001.
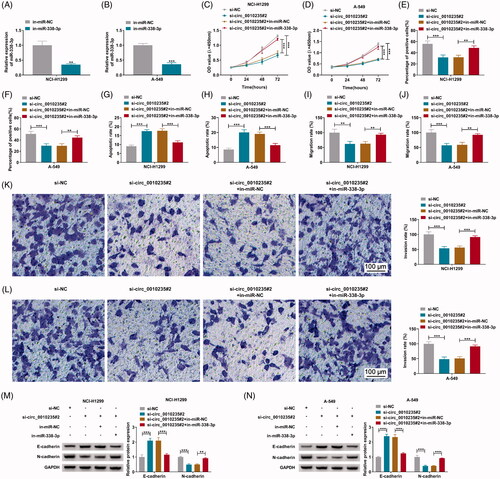
Figure 5. MiR-338-3p could target KIF2A. (A) miR-338-3p response elements are shown in KIF2A 3′UTR WT and MUT according to StarBase software. (B, C) Dual-luciferase reporter assay measured luciferase activity of KIF2A 3′UTR WT and MUT report vectors in NCI-H1299 and A-549 cells transfected with miR-338-3p or miR-NC. (D, G) qPCR detected KIF2A mRNA expression, (E) IHC measured in situ expression of KIF2A, and the scale bar was 50 μm in IHC images and (F, H) western blotting examined KIF2A protein expression in human tumour and adjacent tissues and cells (16HBE, NCI-H1299 and A-549). **p< .01 and ***p< .001.
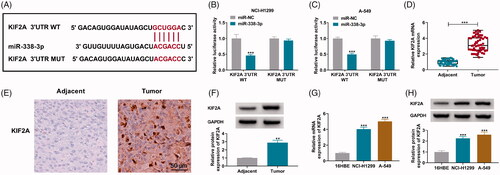
Figure 6. Restoration of KIF2A partially abated the inhibiting effect of miR-338-3p re-expression on NSCLC cell proliferation, migration and invasion. (A) qPCR detected miR-338-3p expression in miR-NC- and miR-338-3p-transfected NCI-H1299 and A-549 cells. (B) Western blotting examined KIF2A protein expression in pcDNA- and pcDNA-KIF2A (KIF2A)-transfected NCI-H1299 and A-549 cells. (C–N) In NCI-H1299 and A-549 cells transfected with miR-NC, miR-338-3p or miR-338-3p combined with pcDNA or KIF2A, (C, D) CCK-8 assay measured OD value at 450 nm during consecutive 72 h, (E, F) EdU assay determined EdU positive rate, (G, H) FCM evaluated apoptotic rate, (I–L) transwell assay confirmed migration rate and invasion rate, and the scale bar was 100 μm in transwell images and (M, N) western blotting detected protein expression of E-cadherin and N-cadherin. *p< .05, **p< .01 and ***p< .001.
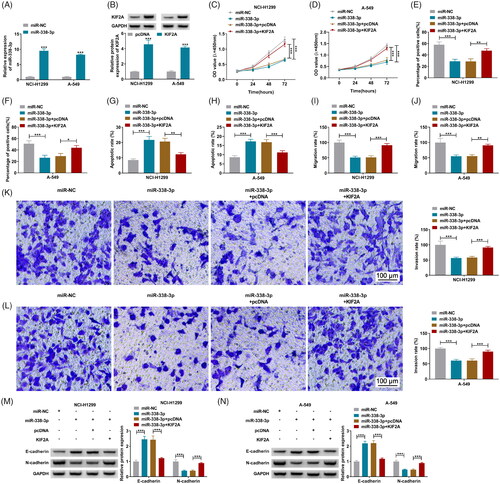
Figure 7. The relationship among circ_0010235, miR-338-3p and KIF2A. (A–C) Pearson’s correlation analysis determined the correlation among circ_0010235, miR-338-3p and KIF2A. (D, E) Western blotting examined KIF2A protein expression in NCI-H1299 and A-549 cells transfected with si-NC, si-circ_0010235#2 or si-circ_0010235#2 along with in-miR-NC or in-miR-338-3p. ***p< .001.
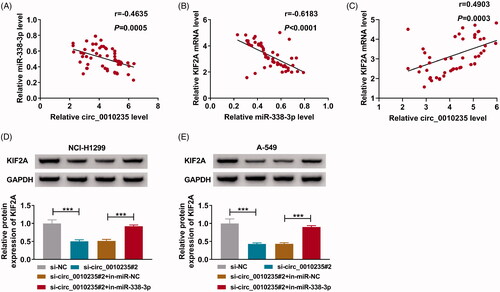
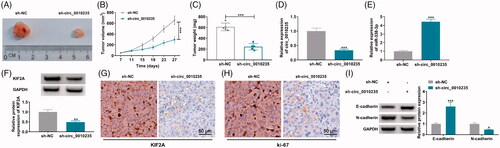
Figure 8. Interference of circ_0010235 delayed tumour growth and metastasis of NSCLC cells by altering miR-338-3p and KIF2A. (A–I) A-549 cells expressing sh-NC or sh-circ_0010235 vectors were inoculated into nude mice (n = 5). (A–C) Tumour volume and weight were examined. (D, E) qPCR detected expression of circ_0010235 and miR-338-3p, (F, I) western blotting examined protein expression of KIF2A, E-cadherin and N-cadherin and (G, H) IHC measured in situ expression of KIF2A and ki-67, and the scale bar was 50 μm in IHC images in xenograft tumour tissues. *p< .05, **p< .01 and ***p< .001.
Data availability statement
All data generated or analysed during this study are included in this article.