
Figures & data
Figure 1. Visfatin expression levels analysis in colon cancerous tissue and paired adjacent non-cancerous tissue. To calculate the difference, non-parametric Wilcoxon matched pairs signed rank test was used. ***, highly significant.
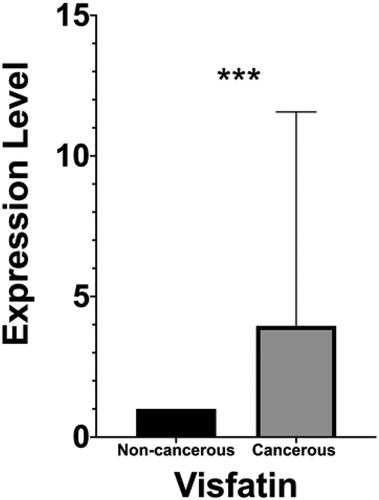
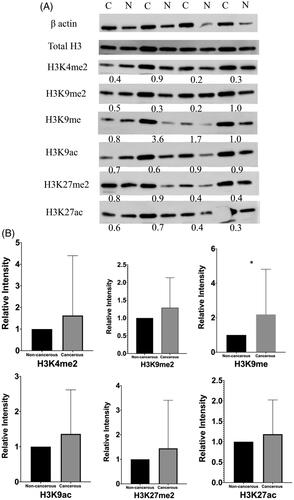
Figure 2. Western blotting of global histone modifications on H3 protein in colon cancerous tissue and paired adjacent non-cancerous tissue. A, six post-translational modifications (H3K4me2, K9me2, K9me, K9ac, K27me2 and K27ac) were measured. β-actin was used as a control. Total H3 was used to validate extraction procedure. The number under each pair of bands in the blots showed relative expression ratios. The ratios <1, =1, and >1 represent decreased, unchanged, or increased expression in cancerous samples, respectively. C, cancerous tissues; N, adjacent non-cancerous tissues. B, columns represent the mean of densitometric values for both cancerous and non-cancerous tissues. H3K9me expression level upregulated in cancerous tissue compared with paired adjacent non-cancerous tissue with P-value <0.05.
Data availability statement
Data are available upon request.