
Figures & data
Table 1. Study Eligibility Criteriaa.
Figure 1. Study flow diagram showing the number of abstracts identified (n = 522); abstracts not meeting criteria (n = 438); full-text articles retrieved (n = 84); full-text articles excluded after screening (n = 53); full-text articles added from grey literature search (n = 6); full-text articles suggested by key informants (n = 2); full-text articles meeting study eligibility criteria (n = 39); eligible randomized controlled trials (n = 32), and observational studies (n = 7).
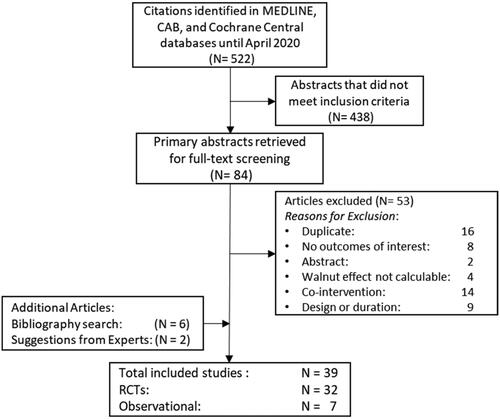
Table 2. Study characteristics and key findings of RCTs reporting the effects of walnut on cognition-related outcomesa.
Figure 2. Risk of bias assessment based on the Cochrane risk-of-bias tool for randomized trials (RoB 2) conducted for five publications reporting cognition and mood outcomes. SC: some concerns.
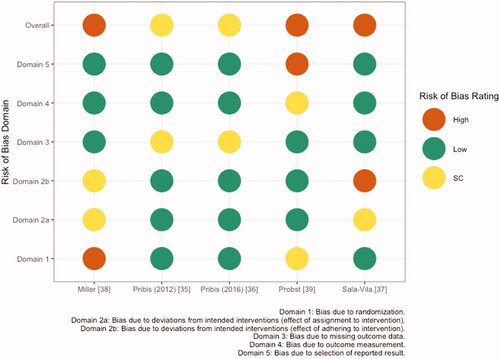
Table 3. Effects of walnut on cognition-related outcomes reported in five RCTsa.
Table 4. Study characteristics and key findings of cross-sectional (n = 6) and prospective cohort studies (n = 1) reporting cognition-related outcomesa.
Table 6. ROB assessment of included observational studies using the Newcastle-Ottawa score for cohort and cross-sectional studiesa.
Figure 3. Risk of bias assessment based on the Cochrane risk-of-bias tool for randomized trials (RoB 2) conducted for twenty-seven publications reporting glucose homeostasis and inflammatory outcomes [HbA1c, HOMA-IR, hsCRP, TNF-a, IL-6, IL-1 E-selectin, sVCAM, sICAM]. SC; some concerns.
![Figure 3. Risk of bias assessment based on the Cochrane risk-of-bias tool for randomized trials (RoB 2) conducted for twenty-seven publications reporting glucose homeostasis and inflammatory outcomes [HbA1c, HOMA-IR, hsCRP, TNF-a, IL-6, IL-1β, E-selectin, sVCAM, sICAM]. SC; some concerns.](/cms/asset/793f0c33-de1f-4464-82d5-00917bd98a07/iann_a_1925955_f0003_c.jpg)
Table 5. Study characteristics of RCTs reporting risk factors for cognitive-declinea.
Figure 4. (a) Effect of walnut intake on HbA1c, reported in ten RCTs with plausible data. (b) Effect of walnut intake on HOMA-IR, reported in 4 RCTs with plausible data. Weights are derived from random-effects analysis. Each grey box represents the individual study’s effect estimate, and the horizontal line represents the 95% CI of the effect estimate. The diamond shape represents the meta-analysis pooled effect estimate and its CI. A vertical line displays the location of the meta-analysis pooled effect estimate. n: number of participants; CI: confidence interval; ROB: risk of bias; SC: some concerns.
Figure 5. Effect of walnut intake on hsCRP, reported in nine RCTs with plausible data. Weights are derived from random-effects analysis. Each grey box represents the individual study’s effect estimate, and the horizontal line represents the 95% CI of the effect estimate. The diamond shape represents the meta-analysis pooled effect estimate and its CI. A vertical line displays the location of the meta-analysis pooled effect estimate. n: number of participants; CI: confidence interval; ROB: risk of bias; SC: some concerns.
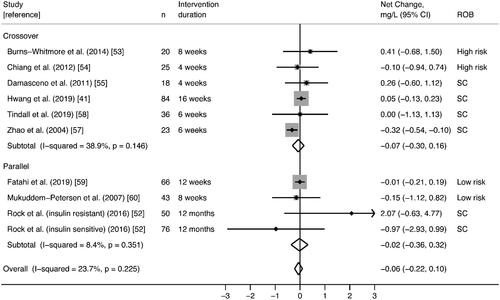
Figure 6. (a) Effect of walnut intake on sICAM-1, reported in seven crossover RCTs with plausible data. (b) Effect of walnut intake on sVCAM-1, reported in five crossover RCTs with plausible data. Weights are derived from random-effects analysis. Each grey box represents the individual study’s effect estimate, and the horizontal line represents the 95% CI of the effect estimate. The diamond shape represents the meta-analysis pooled effect estimate and its CI. A vertical line displays the location of the meta-analysis pooled effect estimate. n: number of participants; CI: confidence interval; ROB: risk of bias; SC: some concerns.
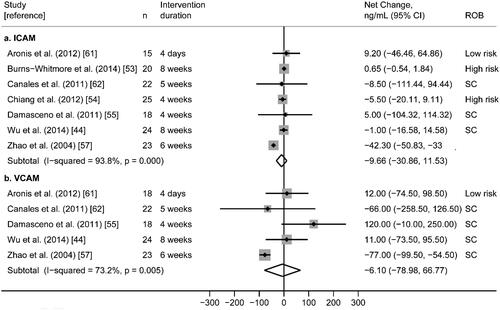
Figure 7. (a) Effect of walnut intake on IL-6, reported in five RCTs with plausible data. (b) Effect of walnut intake on TNF- reported in four RCTs with plausible data. Weights are derived from random-effects analysis. Weights are derived from random-effects analysis. Each grey box represents the individual study’s effect estimate, and the horizontal line represents the 95% CI of the effect estimate. The diamond shape represents the meta-analysis pooled effect estimate and its CI. A vertical line displays the location of the meta-analysis pooled effect estimate. n: number of participants; CI: confidence interval; ROB: risk of bias; SC: some concerns.
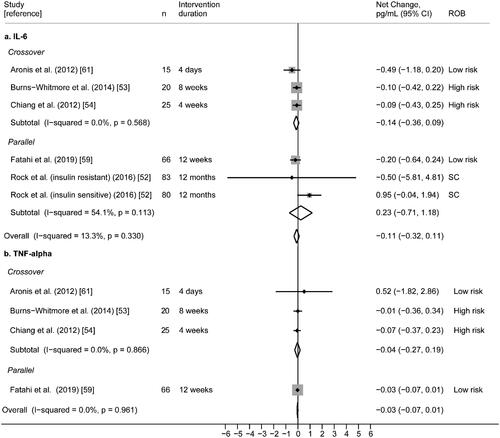
Figure 8. Effect of walnut intake on E-selectin, reported in four RCTs with plausible data. Weights are derived from random-effects analysis. Each grey box represents the individual study’s effect estimate, and the horizontal line represents the 95% CI of the effect estimate. The diamond shape represents the meta-analysis pooled effect estimate and its CI. A vertical line displays the location of the meta-analysis pooled effect estimate. n: number of participants; CI: confidence interval; ROB: risk of bias; SC: some concerns.
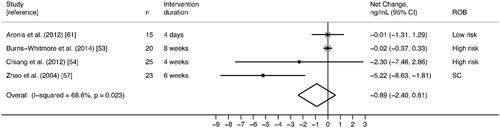
Table 7. GRADE evidence profile tablea.