
Figures & data
Table 1. Basic information of the included studies.
Figure 1. Forest plot showing the association between statin use and the need for intensive care unit care. The squares and bars represent the mean values and 95% CIs of the effect sizes, the area of the squares reflects the weight of the studies, and diamonds represent the combined effects.
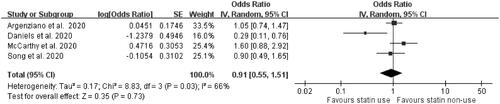
Figure 2. Forest plot showing the association between statins and the need for invasive mechanical ventilator support. The squares and bars represent the mean values and 95% CIs of the effect sizes, the area of the squares reflects the weight of the studies, and diamonds represent the combined effects.
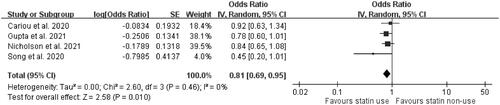
Figure 3. Forest plot showing the association between statins and mortality. The squares and bars represent the mean values and 95% CIs of the effect sizes, the area of the squares reflects the weight of the studies and diamonds represent the combined effects.
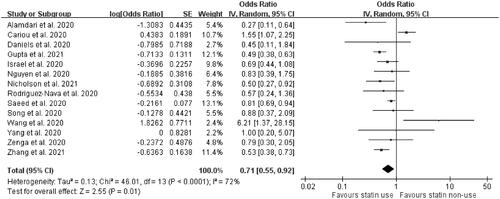
Table 2. Subgroup analysis for COVID-19 mortality.
Supplemental Material
Download ()Data availability statement
The data that support the findings of this study are available from the corresponding author, [Pei-Ling Tang], upon reasonable request.