
Figures & data
Figure 1. Hsa_circ_0042823 was up-regulated in AMC-HN-8 and TU686 cells. (A) The expression of hsa_circ_0042823 in HBECs, AMC-HN-8 and TU686 cells was assessed through qRT-PCR. (B and C) The qRT-PCR was performed to detect hsa_circ_00428233 expression in the AMC-HN-8 and TU686 cells after hsa_circ_0042823 overexpression or knockdown. **p < .01 compared with HBECs; ##p < .01 compared with Vector; $$p < .01 compared with Si-NC.
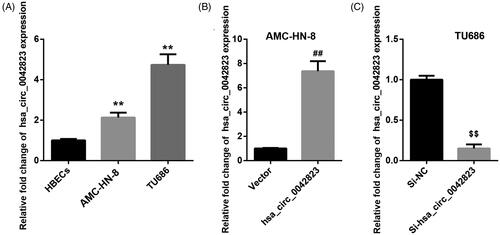
Figure 2. Hsa_circ_0042823 overexpression promoted proliferation, migration and invasion of human laryngeal carcinoma cells. (A and B) MTT assay was performed to examine proliferation of the AMC-HN-8 and TU686 cells after hsa_circ_0042823 overexpression or knockdown. (C and D) Transwell assay was performed to detect migration and invasion of the AMC-HN-8 and TU686 cells after hsa_circ_0042823 overexpression or knockdown. *p < .05, **p < .01 compared with Vector; #p < .05, ##p < .01 compared with Si-NC.
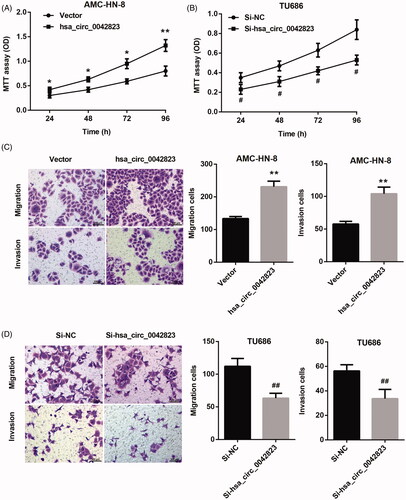
Figure 3. Hsa_circ_0042823 promoted FOXM1 expression by sponging miR-877-5p. (A and B) The relationship among hsa_circ_0042823, miR-877-5p and FOXM1 was verified through luciferase assay. (C and D) The mRNA and protein expression of miR-877-5p and FOXM1 in the AMC-HN-8 cells following hsa_circ_0042823 overexpression was estimated by qRT-PCR and WB. (E and F) The mRNA and protein expression of miR-877-5p and FOXM1 in the TU686 cells following hsa_circ_0042823 knockdown was estimated by qRT-PCR and WB. **p < .01 compared with mimic NC; ##p < .01 compared with Vector; $$p < .01 compared with Si-NC.
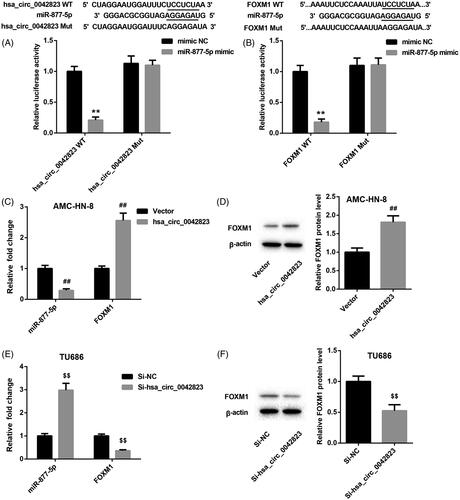
Figure 4. Hsa_circ_0042823 enhanced FOXM1 expression by inhibiting miR-877-5p. (A and B) The mRNA and protein expression of FOXM1 in the AMC-HN-8 cells following up-regulation of hsa_circ_0042823 combined with miR-877-5p was estimated through qRT-PCR and WB. (C and D) The mRNA and protein expression of FOXM1 in the TU686 cells following knockdown of hsa_circ_0042823 combined with miR-877-5p was estimated through qRT-PCR and WB. **p < .01 compared with Vector + mimic NC; ##p < .01 compared with Vector + miR-877-5p mimic; $$p < .01 compared with Si-NC + inhibitor NC; &&p < .01 compared with Si-NC + miR-877-5p inhibitor.
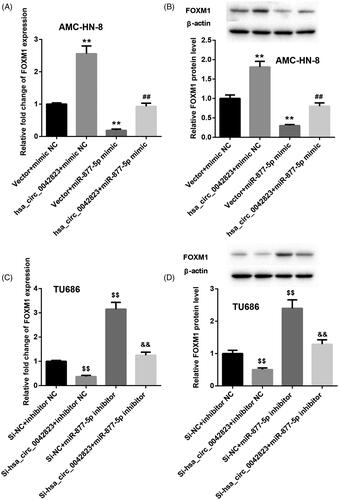
Figure 5. Hsa_circ_0042823 overexpression inhibited miR-877-5p to promote AMC-HN-8 cell proliferation, migration and invasion. (A) MTT assay was performed to explore proliferation of the AMC-HN-8 cells following up-regulation of hsa_circ_0042823 combined with miR-877-5p. (B and C) Transwell assay was performed to detect migration and invasion of the AMC-HN-8 cells following up-regulation of hsa_circ_0042823 combined with miR-877-5p. **p<.01 compared with Vector + mimic NC; ##p<.01 compared with Vector + miR-877-5p mimic.
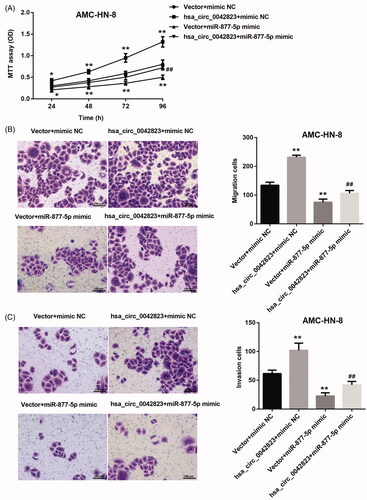
Figure 6. Hsa_circ_0042823 overexpression promoted FOXM1 to enhance AMC-HN-8 cell proliferation, migration and invasion. (A) MTT assay was performed to explore proliferation of the modified AMC-HN-8 cells following hsa_circ_0042823 overexpression combined with FOXM1 knockdown. (B and C) Transwell assay was performed to detect migration and invasion of the AMC-HN-8 cells following hsa_circ_0042823 overexpression combined with FOXM1 knockdown. **p<.01 compared with Vector + Si-NC; ##p<.01 compared with Vector + Si-FOXM1.
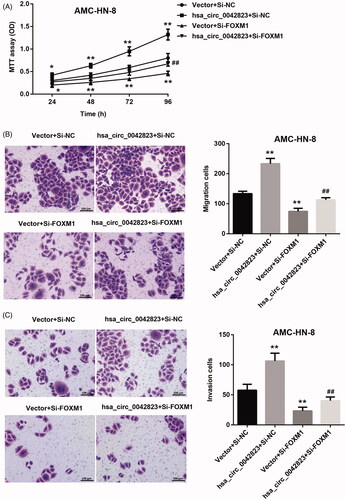
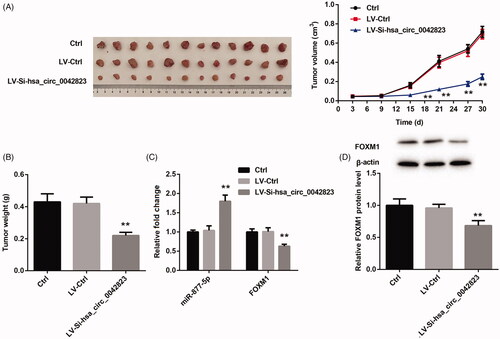
Figure 7. Hsa_circ_0042823 knockdown inhibited the tumour growth of LSCC via miR-877-5p/FOXM1 axis. (A and B) The tumour volume and weight in Ctrl, LV-Ctrl and LV-Si-hsa_circ_0042823 groups was measured. (C and D) The mRNA or protein expression of miR-877-5p and FOXM1 in Ctrl, LV-Ctrl and LV-Si-hsa_circ_0042823 groups was estimated by qRT-PCR and WB. **p<.01, compared with LV-Ctrl.
Data availability statement
The datasets in this study are available from the corresponding author on reasonable request.