
Figures & data
Figure 1. Identification of genes related to TNBC-specific glucose metabolism. (A) Sample clustering to detect outliers. (B) Determination of soft threshold by evaluating the scale-free topology fit index (left) and mean connectivity (right). (C) Dendrogram plot with colour annotation. (D) Heatmap for the correlations of gene modules to SUV. Correlations between module membership and gene significance values were presented in scatterplots for the blue (E) and black (F) gene modules. TNBC: Triple-negative breast cancer; SUV: standardised uptake value.
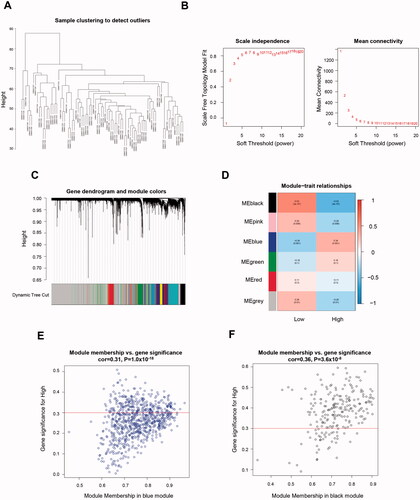
Figure 2. GO and KEGG enrichment analysis for metabolism-related hub genes. (A) Major GO enrichment terms in hub gene clusters correlated to metabolism; (B) KEGG pathway enrichment in hub gene clusters correlated to metabolism. GO: Gene ontology; KEGG: Kyoto Encyclopaedia of Genes and Genomes.
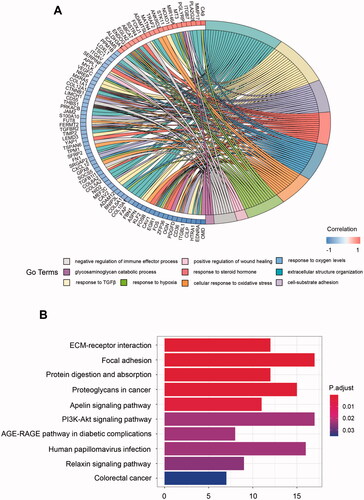
Figure 3. Identification of immune-related genes in TNBC. (A) Volcano plot showing differentially expressed genes. (B) Dendrogram plot with colour annotation. (C) Heatmap for the correlations of gene modules to PD-(L)1. Scatterplots for correlations between module membership and gene significance values concerning PD-1 (D) and PD-L1 (E) expression for the brown gene module. (F) Venn diagram of overlapping genes identified by the immune-related gene set and metabolic gene set. TNBC: Triple-negative breast cancer.
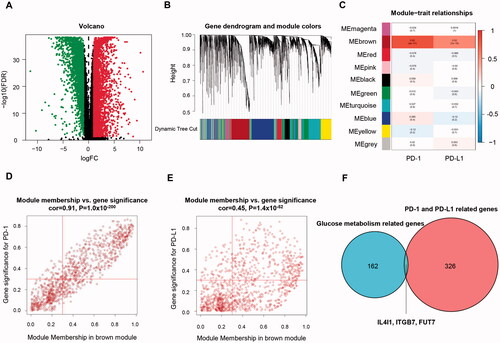
Figure 4. Correlation between hub gene expression and SUV and PD-(L)1 expression. The Spearman correlation coefficients between IL4I1 (A–C), ITGB7 (D to F), and FUT7 (G–I) expression and SUV, PD-1, and PD-L1 levels were shown. SUV: Standardised uptake value.
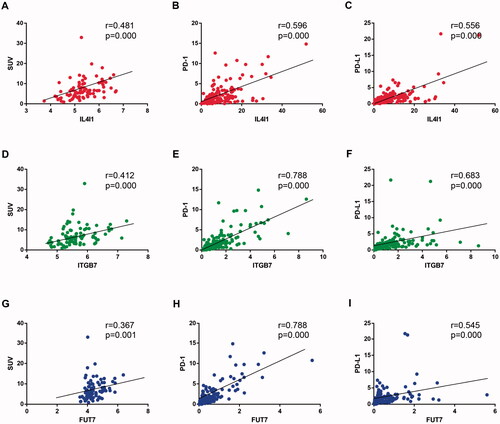
Figure 5. Expression levels of IL4I1 (A,B), ITGB7 (C,D), and FUT7 (E,F) in different breast cancer subtypes or TNBC subtypes. TNBC: triple-negative breast cancer.
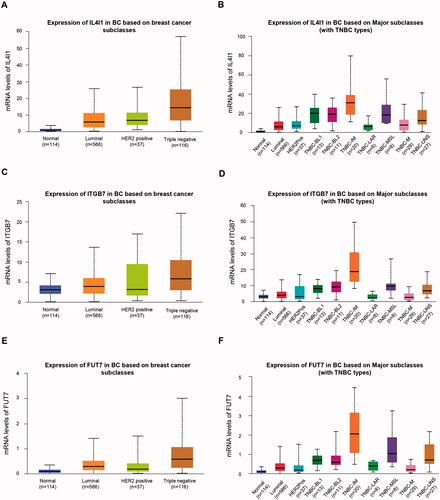
Figure 6. GSEA analysis of TNBC grouped by IL4I1, ITGB7, and FUT7 expression. GSEA was performed on RNA-Seq data of 146 TNBC samples grouped by IL4I1, ITGB7, and FUT7 expression levels, respectively. Representative pathways of IL4I1 (A–C), ITGB7 (D–F), and FUT7 (G–I) were shown. GSEA: gene set enrichment analysis.
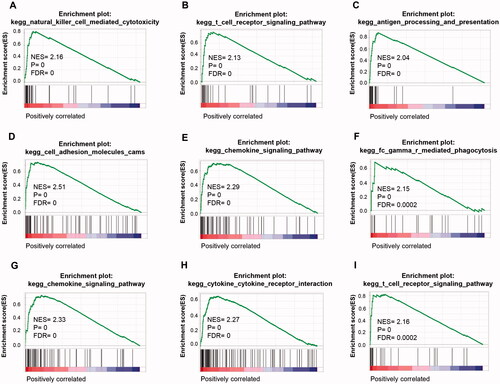
Figure 7. Immune cell infiltration analysis. The TIMER was used to evaluate the correlations between immune cell abundance and IL4I1 (A), ITGB7 (B), and FUT7 (C) expressions in basal breast cancer. TIMER: Tumour immune estimation resource.
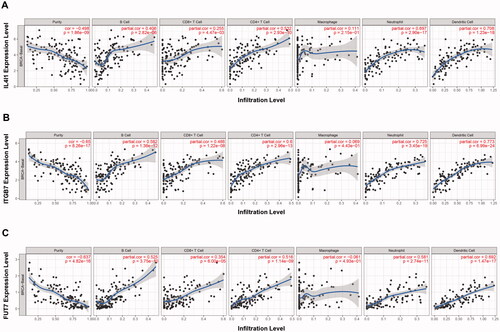
Table 1. Correlation analysis between IL4I1, ITGB7, and FUT7 and relate genes and markers of immune cells in GEPIA2.
Supplemental Material
Download ()Data availability statement
The data that support the findings of this study are openly available in Gene Expression Omnibus (GEO) database, GSE135565 dataset (http://www.ncbi.nlm.nih.gov/geo/).