
Figures & data
Table 1. Clinical characteristics of included subjects.
Figure 1. Receiver operating characteristic (ROC) curve of the use of COPD-PS to discriminate between COPD patients and controls. COPD-PS: chronic obstructive pulmonary disease population screener.
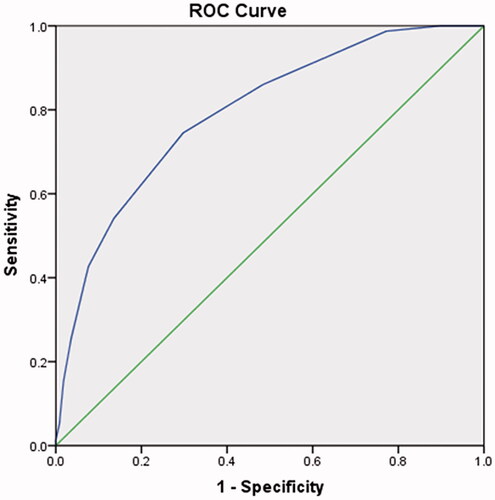
Table 2. Performance of COPD-PS in detecting COPD with various cut-off values.
Figure 2. Quality assessment of studies on COPD-PS. COPD-PS: chronic obstructive pulmonary disease population screener.
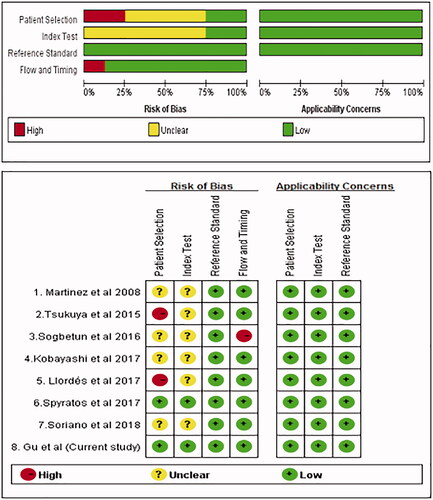
Table 3. Clinical summary of included studies.
Figure 3. Forest plot of sensitivity COPD-PS with random-effects model. The point estimates of sensitivity from each study are shown as solid circles. Error bars indicate 95% CIs. COPD-PS: chronic obstructive pulmonary disease population screener.
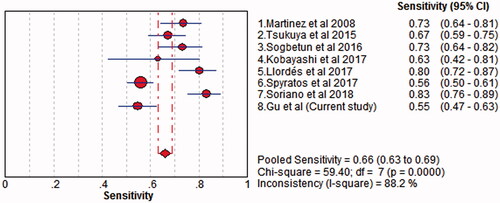
Figure 4. Forest plot of specificity of COPD-PS with random-effects model. The point estimates of specificity from each study are shown as solid circles. Error bars indicate 95% CIs. COPD-PS: chronic obstructive pulmonary disease population screener.
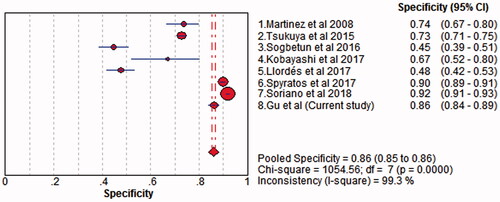
Figure 5. Forest plot of diagnostic odds ratio of COPD-PS with random effects model. The point estimates of specificity from each study are shown as solid circles. Error bars indicate 95% CIs. COPD-PS: chronic obstructive pulmonary disease population screener.
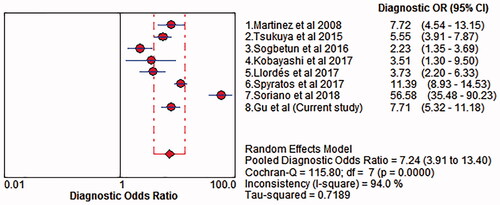
Figure 6. Summary receiver operating characteristic (SROC) curve of COPD-PS as a screening tool for COPD. COPD-PS: chronic obstructive pulmonary disease population screener. Q: The maximum joint value of sensitivity and specificity of COPD-PS.
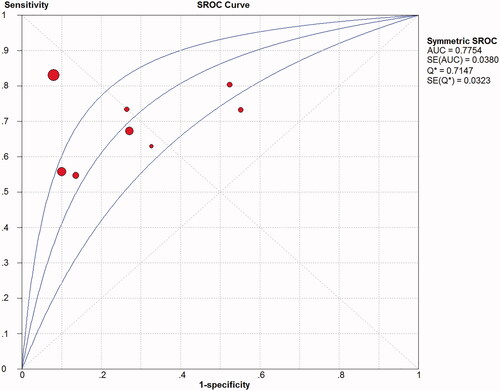
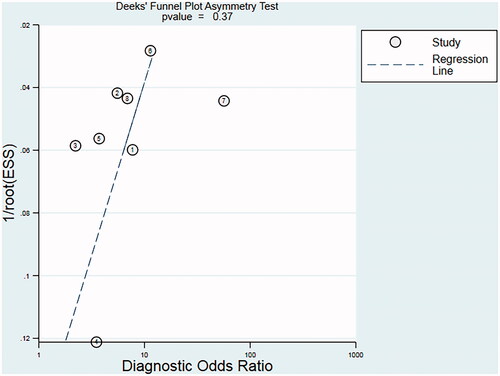
Figure 7. Deeks’ funnel plot assessing the likelihood of publication bias. The statistically nonsignificant p-value of 0.37 for the slope coefficient suggests symmetry in the data and a low likelihood of publication bias. ESS: effective sample size, corresponding to 4 × Ncontrol × NCOPD/(Ncontrol + NCOPD).
Supplemental Material
Download ()Data availability statement
All data used to support the findings of this study are available from the corresponding authors upon reasonable request.