
Figures & data
Figure 1. Multi-model imaging of MFC with CNV, mCNV, and ICNV. Line a: MFC with CNV. (A) The colour fundus photograph shows multiple small yellowish lesions and a few scattered atrophic spots. (B, C) FFA showing early hyperfluorescence and late leakage is the typical characteristic of type 2 CNV. (D) The late phases of ICGA show macular lesion with hyperfluorescence and there are multiple hypofluorescence spots which are greater in number and larger than those observed using fundus photography and FFA. (E) OCT scans corresponding to red arrowheads in image D demonstrate subretinal hyperreflective material overlying the RPE. (F) OCT scans corresponding to the green arrowhead in image D demonstrate that the photoreceptor layer around the lesion is lost; choroidal hyperreflectivity is well demonstrated here. (G) OCTA revealed detectable flow above the RPE. Line b: mCNV. (H) Colour fundus photograph of the left eye shows a tilted optic disc, posterior staphyloma, peripapillary atrophy, leopard fundus, and a greyish lesion surrounded with a hyperpigmented border at macular. (I, J) Early phase of the fluorescein angiogram showing very small, well-defined hyperfluorescence with minimal leakage in the late phases. (K) The late phases of ICGA show hyperfluorescence and a lacquer crack around the CNV. (L) OCT showing a hyper-reflective lesion corresponding to myopic CNV and a thinning choroidal layer. (M) OCTA shows detectable flow above the RPE. Line c: Typical ICNV. (N–R) The colour fundus photograph, FFA, and ICGA OCT of the ICNV showed there were only the typical characteristics of type 2 CNV. (S) The OCTA of the ICNV revealed detectable flow above the RPE. CNV: choroidal neovascularization; MFC: multifocal choroiditis; ICGA: indocyanine angiography; OCT: optical coherence tomography; FFA: fundus fluorescein angiography; mCNV: myopic choroidal neovascularization; ICNV: idiopathic choroidal neovascularization; RPE: retinal pigment epithelium; OCTA: optical coherence tomography angiography.
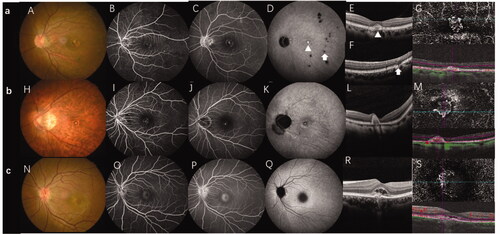
Figure 2. Schematic diagram of the OCT biomarker and measurement of CNV lesions. (A) The yellow double arrow indicates the disrupted ellipsoid zone length and the red double arrow indicates the CNV diameter. The purple double arrow indicates the height of entire lesion, the blue double arrow indicates the height of the CNV, and the green double arrow indicates the choroidal thickness. The yellow arrow-head indicates the hyperreflective dots and the asterisk (※) indicates the area with a low reflected signal, i.e. the subretinal fluid. (B) The yellow arrow indicates a subretinal hyperreflective exudate. C. The yellow arrow indicates the "pitchfork sign." CNV: choroidal neovascularization; OCT: optical coherence tomography.
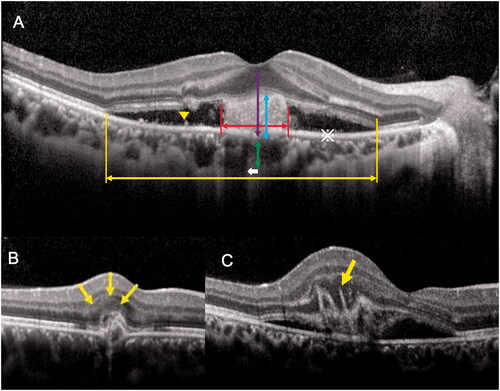
Table 1. Comparison between the MFC secondary to CNV, mCNV, and ISCNV groups.
Figure 3. The ROC curve of the CNV diameter and CT value in distinguishing CNV secondary to multifocal choroiditis and myopic CNV. ROC: receiver operator characteristic; CNV: choroidal neovascularization; CT: choroidal thickness.
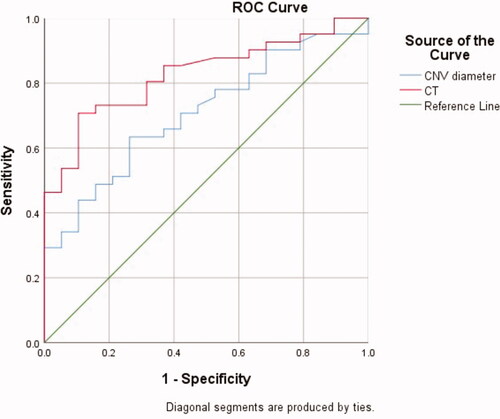
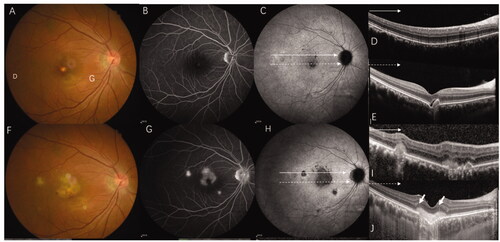
Figure 4. Multimodal images of a 36-year-old woman with high myopia (-9D in both eyes) where it was difficult to determine the aetiology of CNV. (A) A colour fundus photograph of the right eye shows typical high myopia changes including peripapillary atrophy, leopard fundus, and posterior staphyloma. In addition, there is a yellowish lesion in the macular region (green arrow) corresponding to CNV as well as two very small lesions (yellow arrow) in the infer-temporal retina. (B, C) FFA showing early hyperfluorescence and late leakage. (D) Late phase of ICGA showing a lacquer crack underneath the CNV lesion (red arrow) and a hyporeflective spot which corresponds to a very small lesion which can be seen in the fundus photograph (yellow arrow). (E, F) OCT scan of the CNV lesions (green line) shows high reflectance on the RPE and rupture of the ellipsoid zone. (G) OCT scan of the lesion seen in the fundus photograph and ICGA (yellow arrow) shows sub-RPE hyperreflexia with choroidal hyper-transmission and adjacent ellipsoid zone disruption which is similar to OCT findings of an inflammation lesion caused by MFC/PIC. CNV: choroidal neovascularization; MFC; multifocal choroiditis; OCT: optical coherence tomography; FFA: fundus fluorescein angiography; RPE: retinal pigment epithelium.
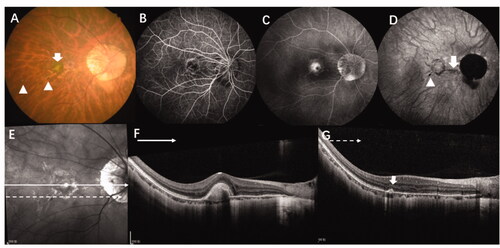
Figure 5. This 36-year-old women with myopia (-5 D in her right eye) complained of decreased visual acuity in her right eye for 5 days and was diagnosed with ICNV via multimodal imaging at her first visit. However, after being treated with anti-VEGF four times and after 6-months of follow-up, the final diagnosis was CNV secondary to MFC. (A–E) Multimodal image of the right eye, which was diagnosed with ICNV at the first visit. (A, B) The fundus photograph and FA only show the CNV lesion. (C) ICGA shows multiple hypofluorescence in the late phases. (D, E). OCT shows normal at superior part of macular (green line) and a CNV legion (yellow line). (F, G) Multimodal image of the same patient at the six-month follow-up. (F–H) The fundus photograph, FA, and ICGA show multiple new lesions. (I) The OCT scan of the same layer with figure D after 6 months shows a well-demarcated dome-shaped homogenous lesion (red arrow) and other new lesions with choroidal hyperreflectivity. (G) The CNV becomes larger and the "pitchfork sign" (yellow pointed arrow) is visible. Thus, the final diagnosis was CNV secondary to MFC. CNV: choroidal neovascularization; MFC: multifocal choroiditis; ICGA: indocyanine angiography; OCT: optical coherence tomography; FFA: fundus fluorescein angiography.
Data availability statement
All data that support the findings of this study are available from the corresponding author upon request.