
Figures & data
Figure 1. Changes in ΔBF during the follow-up period. The estimates of ΔBF (kg) were gradually increased throughout the follow-up period. The distributions of ΔBF became wider, and the estimates of SD were gradually increased concomitant to an increase in the follow-up duration. In contrast, the distribution of ΔBF/SDT remained steady during the follow-up period, and the trending pattern of the estimates of ΔBF/SDT was remarkably similar to that of the estimates of ΔBF. *The estimates, CIs, and SD of ΔBF or ΔBF/SDT were derived using a LOESS model.
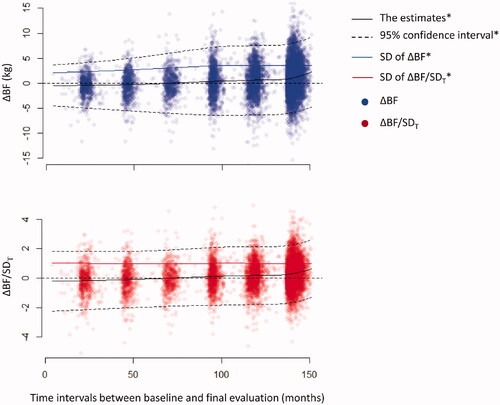
Table 1. Baseline characteristics of the participants according to the groups.
Table 2. Body composition measurements in the participants according to the groups.
Figure 2. Cumulative incidence of all-cause death, CV death, and MACE. Cumulative incidence of all-cause death, CV death, and MACE was the lowest in the participants with ΔBF/SDT ≥ 1 and was the highest in the participants with ΔBF/SDT < −1.
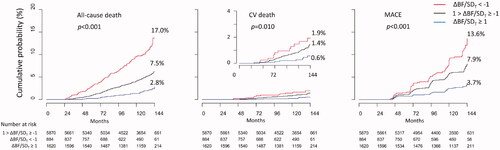
Figure 3. Cox proportional hazard models for all-cause death, CV death, and MACE. Increasing BF was associated with higher risks of all-cause death, CV death, and MACE, and decreasing BF was associated with lower risks of all-cause death, CV death, and MACE in the entire study population and in the subgroup without MACE at the index visit. *The p-values were estimated by ANOVA comparisons of the clinical event risks between the groups (for categorical variables) or per increment of 1 for ΔBF/SDT (for continuous variables). **The analyses were conducted in the subgroup of participants without MACE at the index visit, and the inverse probability of the treatment weighting was applied before the generation of multivariate models.
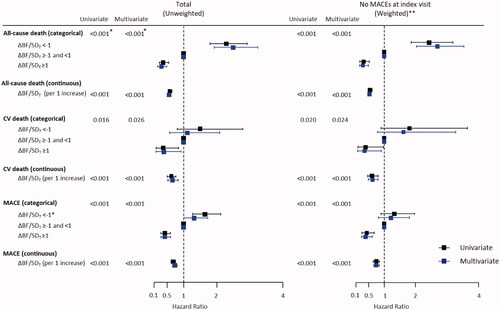
Figure 4. Relationships between ΔBF/SDT and the risks for all-cause death, CV death, and MACE. The results of analysis of multivariate non-linear Cox proportional hazard models indicated that the risk of all-cause death was gradually decreased concomitant to an increase in ΔBF/SDT, and the risk of CV death and MACE remained steady if ΔBF/SDT was <0 and decreased if ΔBF/SDT was ≥0. Restrictive cubic spline models with four knots were used to fit the data.
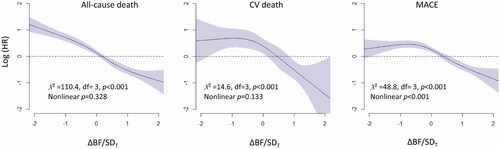
Figure 5. The relationships between sBF%i and clinical outcomes in the absence or in the presence of ΔBF/SDT as a covariate. The results of the univariate model analysis indicated that higher sBF%i was not associated with the risks of all-cause death and CV death but was associated with a higher risk of MACE. The results of multivariate model analysis without ΔBF/SDT as a covariate indicated that sBF%i was not associated with the risks of all clinical events. In contrast, the results of the multivariate model analysis with ΔBF/SDT as a covariate indicated that higher sBF%i was associated with a lower risk of all clinical events. A restrictive cubic spline fit with four knots was used for all models, and all multivariate models were reduced using a backward variable selection procedure. *Model 1 includes age, sex, sWHRi, eGFR, income, MI, non-MI CAD, stroke, heart failure, PAD, diabetes, hypertension, malignancy, regular exercise, physical activity at the index visit, current smoking, and current alcohol drinking. **Model 2 = model 1 + ΔBF/SDT. MI: myocardial infarction; PAD: peripheral artery disease; sBF%i: standardized BF percentage at the index visit; sWHRi: standardized WHR at the index visit.
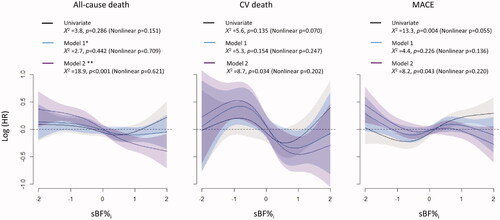
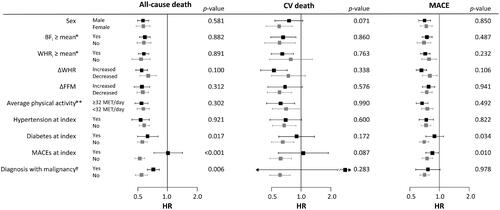
Figure 6. Subgroup analysis for the influence of ΔBF/SDT on the risks of all-cause death, CV death, and MACE. Associations of higher ΔBF/SDT with lower risks of all-cause death and MACE were stronger in participants with MACE and in participants with diabetes at the index visit. Associations of higher ΔBF/SDT with a lower risk of all-cause death were stronger in participants who had never been diagnosed with or died of malignancy during the follow-up period. No other subgroups, including the subgroups based on BFi, WHRi, ΔFFM, ΔWHR, and average physical activity during the follow-up period, had a significant impact on the associations. Only two CV deaths occurred in the participants diagnosed with malignancy during follow-up, resulting in an extremely wide 95% CI. *Sex-specific means. **Average physical activity throughout the follow-up period. †Diagnosis with or death of any malignancies during the follow-up period. p-Values correspond to the interaction of the variables.
Supplemental Material
Download ()Data availability statement
Access to the data is regulated by the Korean Centres for Disease Control and Prevention. The data are opened to any researchers without charge if the study protocol is approved by appropriate ethical committees, and proper applications for research permission are filed on the website of the Korean Centres for Disease Control and Prevention (http://nih.go.kr/contents.es?mid=a40504060100).
The final datasets and unedited complete R scripts used for the statistical analyses were uploaded to the following data repository (https://osf.io/bzycj/?view_only=c6caf5cf27ed418489b3df2fdfe20669). The detailed explanations for the codes in the R script are provided in Supplementary Data 3 and the complete R script for the statistical analysis were also provided in Supplementary Data 4. The datasets and R scripts can also be requested from the corresponding author, Yonggu Lee, M.D., Ph.D. ([email protected]; [email protected]).