
Figures & data
Table 1. Baseline demographic and clinical data of patients with chronic cough treated with inhaled corticosteroids (ICS) in included studies.
Table 2. Characteristics related to study design and inhaled corticosteroids (ICS) treatment in included studies.
Figure 1. Quality of included studies according to Quality Assessment of Diagnostic Accuracy Studies 2 (QUADAS-2) criteria.
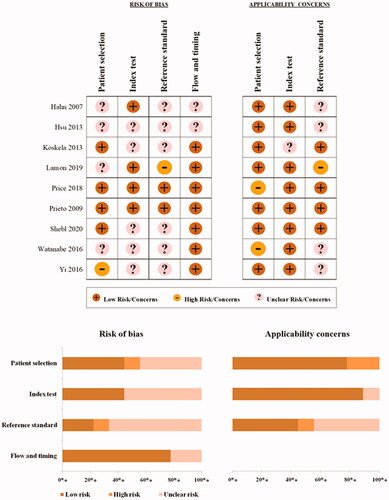
Figure 2. Forest plots of cough response to inhaled corticosteroids in patients with high and low fractional exhaled nitric oxide (A) and of the mean difference in fractional exhaled nitric oxide between responders and non-responders (B). FeNO: fractional exhaled nitric oxide; 95%CI: 95% confidence interval. Squares represent the Odds Ratio of steroid response in chronic cough patients with a high and low FeNO in each study (A) or the Mean Difference in FeNO between responders and non-responders to corticosteroids. Lines are the 95% confidence intervals. The black diamond represents the cumulative Odds Ratio (A) or the cumulative Mean Difference (B) for analysed studies.
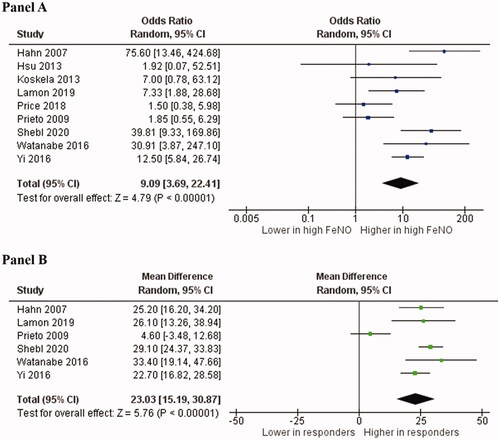
Figure 3. Pooled estimates of sensitivity and specificity for the association between high fractional exhaled nitric oxide (FeNO) and response to inhaled corticosteroids in chronic cough, with Fagan’s nomogram from pooled likelihood ratios. 95%CI: 95% confidence interval. Squares represent the sensitivity or specificity for the association between high FeNO and response to inhaled corticosteroids. Lines are the 95% confidence intervals.
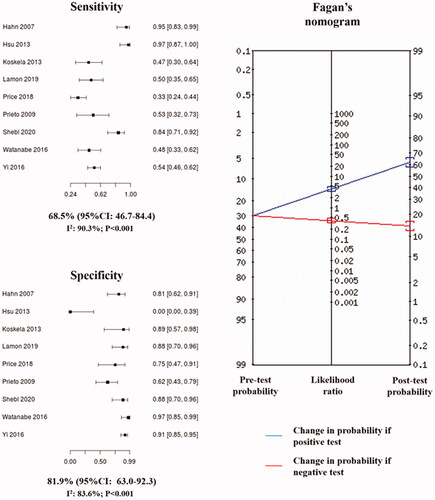
Figure 4. Hierarchical Summary Receiver Operating Characteristic (HSROC) curve (A) and Deeks test for funnel plot asymmetry (B). HSROCAUC: area under the HSROC curve; ESS: effective sample size.
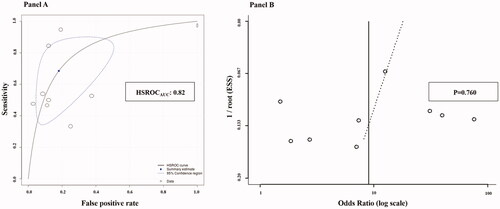
Table 3. Pooled diagnostic indexes for the association between high fractional exhaled nitric oxide (FeNO) and response to inhaled corticosteroids in sensitivity and subgroup analyses.
Supplemental Material
Download ()Data availability statement
The data that support the findings of this study are available from the corresponding author [M.M.] upon reasonable request.