
Figures & data
Table 1. Nogo-A, MAG, and OMgp concentrations in patients with brain tumours compared to non-tumoural individuals.
Figure 1. (A) CSF Nogo-A dot plots for the astrocytic and meningeal brain tumour groups and non-tumoural individuals. (B) Serum MAG dot plots for the astrocytic and meningeal brain tumour groups and non-tumoural individuals. (C) Serum OMgp dot plots for the astrocytic and meningeal brain tumour groups and non-tumoural individuals. p < .05 is considered to be statistically relevant. CSF: cerebrospinal fluid.
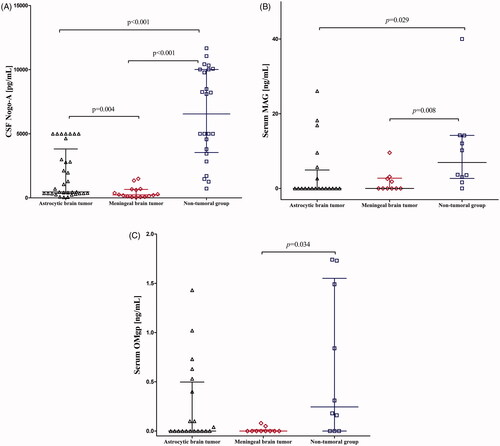
Table 2. Logistic regression analysis.
Figure 2. (A) ROC curves for CSF Nogo-A (AUC ± SE = 0.909 ± 0.033, p < .001; YI = 0.65; SE = 65%; SP = 100%; AC = 77%; PPV = 100%; NPV = 59%) and serum MAG (AUC ± SE = 0.797 ± 0.079, p < .001; YI = 0.57; SE = 77%; SP = 80%; AC = 78%; PPV = 92%; NPV = 53%) for differentiating the combined brain tumour groups from non-tumoural individuals. (B) ROC curves for CSF Nogo-A (AUC ± SE = 0.871 ± 0.045, p < .001; YI = 0.56; SE = 73%; SP = 83%; AC = 77%; PPV = 86%; NPV = 69%) and serum MAG (AUC ± SE = 0.770 ± 0.090, p = .003; YI = 0.60; SE = 70%; SP = 90%; AC = 77%; PPV = 93%; NPV = 60%) for differentiating the astrocytic brain tumour group from non-tumoural individuals. C: ROC curves for CSF Nogo-A (AUC ± SE = 0.987 ± 0.013, p < .001; YI = 0.88; SE = 88%; SP = 100%; AC = 95%; PPV = 100%; NPV = 92%) and serum MAG (AUC ± SE = 0.850 ± 0.089, p < .001; YI = 0.60; SE = 80%; SP = 80%; AC = 80%; PPV = 80%; NPV = 80%) for differentiating the meningeal brain tumour group from non-tumoural individuals. ROC: receiver operating characteristic; CSF: cerebrospinal fluid; AUC: area under the ROC curve; SE: standard error; Cut-off: optimal cut-off based on the highest Youden Index; YI: Youden Index; SE: sensitivity; SP: specificity; AC: diagnostic accuracy; PPV: positive predictive value; NPV: negative predictive value.
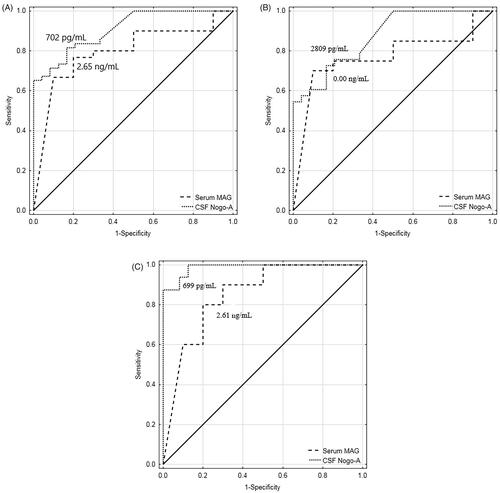
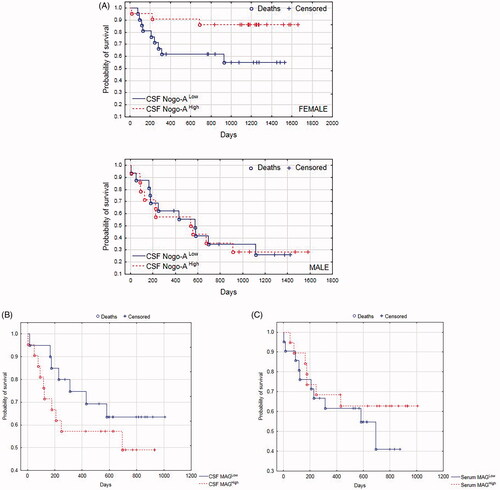
Figure 3. (A) Kaplan–Meier survival analysis for the total study group. Males and females were analyzed separately. Based on CSF Nogo-A median concentrations, males/females were divided into those with CSF Nogo-ALow (≤median; Me = 1356 pg/mL) and those with CSF Nogo-AHigh (>median). (B) Kaplan–Meier survival analysis for the whole study group. Based on CSF MAG median concentrations, patients were divided into those with CSF MAGLow (≤median; Me = 7.43 ng/mL) and those with CSF MAGHigh (>median). (C) Kaplan–Meier survival analysis for the whole study group. Based on serum MAG median concentrations, patients were divided into those with serum MAGLow (≤median; Me = 0.00 ng/mL) and those with serum MAGHigh (>median). CSF, cerebrospinal fluid.
Supplemental Material
Download ()Data availability statement
The datasets generated and/or analyzed during the current study are not publicly available, but are available from the corresponding author (OMK-L) on a request.