
Figures & data
Table 1. Anthropometric characteristics of the participants.
Table 2. Two-way ANOVA for the influence of age and sex in mTUG.
Figure 1. The mTUG test score by age and sex.
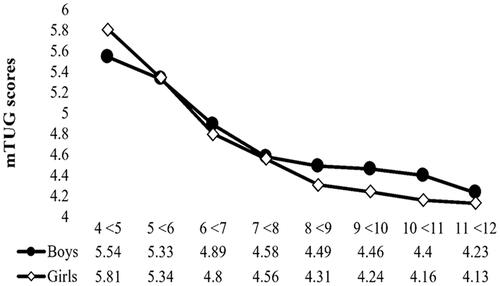
Table 3. Linear regression analysis for predicting mTUG.
Figure 2. Comparison of mTUG scores measured in this study (Saudi) with previous studies.
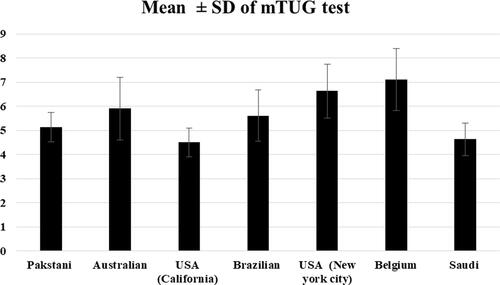
Figure 3. Bland and Altman plot, of measured and predicted mTUG determined from the reference equation of Brazilian children [Citation10]. r2: determination-coefficient; r: correlation-coefficient; p: probability. Upper confidence interval value (CI) = Mean +1.96 SD. Lower confidence interval value (CI) = Mean − 1.96 SD.
![Figure 3. Bland and Altman plot, of measured and predicted mTUG determined from the reference equation of Brazilian children [Citation10]. r2: determination-coefficient; r: correlation-coefficient; p: probability. Upper confidence interval value (CI) = Mean +1.96 SD. Lower confidence interval value (CI) = Mean − 1.96 SD.](/cms/asset/066552a8-3491-4eed-be46-977cb4937842/iann_a_1986638_f0003_b.jpg)
Data availability statement
The data that support the findings of this study are available on request from the corresponding author [M.A]. The data are not publicly available due to their containing information that could compromise the privacy of research participants.