
Figures & data
Figure 1. Percentage distribution of Impact of Event Scale (IES-R) total score among the study participants (n = 468).
Notes: IES-R cut-offs to define normal (0–8), mild (9–25), moderate (26–43) and severe (44–88) post-traumatic stress symptoms are marked as dashed vertical lines.
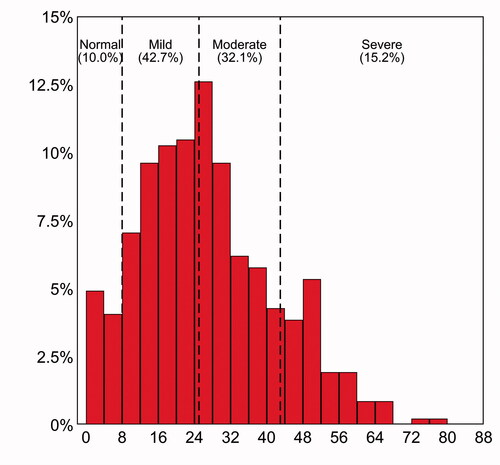
Table 1. Characteristics of the study patients (n = 468). Values are counts (percentages) or mean ± standard deviation [interquartile range].
Table 2. Results of simple (bivariate) linear regression analysis for subjective distress caused by SARS-COV-2 pandemic, as measured by the Impact of Event Scale (IES-R) total score.
Table 3. Results of multivariable linear regression analysis for subjective distress caused by SARS-COV-2 pandemic, as measured by the Impact of Event Scale (IES-R) total score.
Table 4. Relationship of specific signs of generalized anxiety disorder (GAD-7 items) with subjective distress caused by SARS-COV-2 pandemic, as measured by the Impact of Event Scale (IES-R) total score.
Data availability statement
Tha data analysed in this paper cannot be made open in compliance with the study protocol.