
Figures & data
Figure 1. Patient flow diagram.
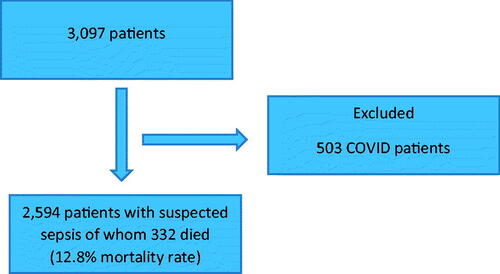
Table 1. The baseline characteristics of the study population.
Figure 2. Receiver operator characteristic (ROC) curves for the REDS and comparator scores, for in-hospital mortality. REDS: risk-stratification of emergency department suspected sepsis; SIRS systemic inflammatory response syndrome; NEWS2: national early warning score 2; SOFA: sequential organ failure assessment; MEDS: mortality in emergency department sepsis; PIRO: patient infection response organ; CURB65: confusion urea respiratory rate blood pressure 65 (years); AUROC: area under receiver operator characteristic curve for the REDS score 0.73 (95% confidence interval [CI] 0.72–0.75); SIRS criteria 0.51 (95% CI 0.49–0.53); NEWS2 0.69 (95% CI 0.67–0.70), CURB65 0.71 (95% CI 0.69–0.72); SOFA score 0.74 (95% CI 0.72–0.76), MEDS score 0.75 (95% CI 0.73–0.75); PIRO 0.74 (95% CI 0.72–0.75).
![Figure 2. Receiver operator characteristic (ROC) curves for the REDS and comparator scores, for in-hospital mortality. REDS: risk-stratification of emergency department suspected sepsis; SIRS systemic inflammatory response syndrome; NEWS2: national early warning score 2; SOFA: sequential organ failure assessment; MEDS: mortality in emergency department sepsis; PIRO: patient infection response organ; CURB65: confusion urea respiratory rate blood pressure 65 (years); AUROC: area under receiver operator characteristic curve for the REDS score 0.73 (95% confidence interval [CI] 0.72–0.75); SIRS criteria 0.51 (95% CI 0.49–0.53); NEWS2 0.69 (95% CI 0.67–0.70), CURB65 0.71 (95% CI 0.69–0.72); SOFA score 0.74 (95% CI 0.72–0.76), MEDS score 0.75 (95% CI 0.73–0.75); PIRO 0.74 (95% CI 0.72–0.75).](/cms/asset/7e93b03e-9d9d-4ce1-9dd7-6c00e228e2ab/iann_a_1992495_f0002_c.jpg)
Table 2. The AUROC curves, the cut-off points and the test characteristics of the REDS and comparator scores.
Table 3. The AUROC curves, the cut-off points and the test characteristics of the REDS and comparator scores after exclusion of patients with missing variables.
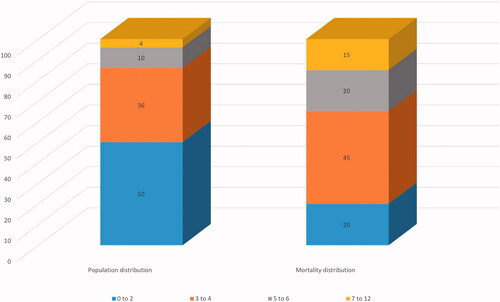
Figure 3. The percentage distribution of the REDS score through the study population and the percentage distribution of the REDS score through the deceased population. REDS score: risk-stratification of emergency department suspected sepsis score. Percentages have been rounded to the closest 1%.
Data availability statement
All data used is included in the manuscript.