
Figures & data
Figure 1. Flow chart for inclusion and exclusion of patients.
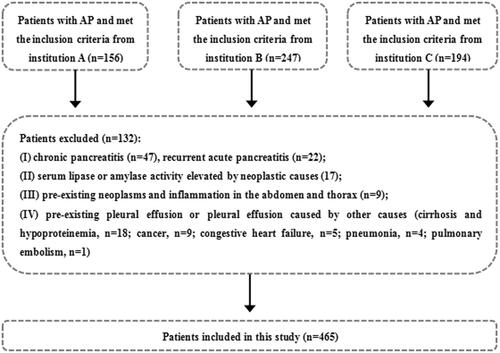
Figure 2. The measurement of pleural effusion volume with chest CT images.
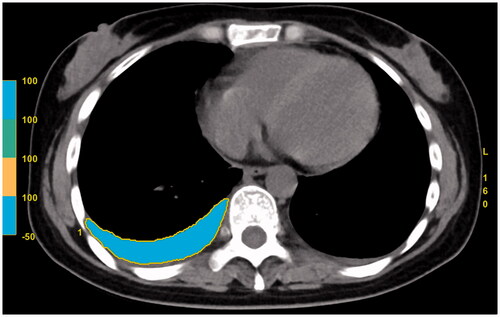
Table 1. Basic characteristics and aetiology of acute pancreatitis in 465 patients.
Table 2. Clinical and severity outcomes of acute pancreatitis in 465 patients.
Figure 3. Mild interstitial oedematous pancreatitis (IEP) in a 57-year-old female (CRP level of 28 mg/L, Ranson, BISAP, Marshall, APACHE II, CTSI, and EPIC of 1, 1, 0, 4, 4, and 3 points, respectively; there was no infection, procedure, ICU admission, organ failure, or death on this patient). Abdominal axial contrast-enhanced CT at the portal phase (A) showed there was a small amount of acute peripancreatic fluid collection (APFC) around the pancreas. Axial chest image CT (B) showed there was a small amount of bilateral pleural effusion.
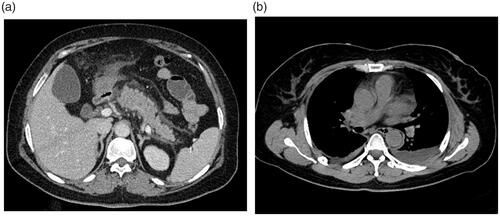
Figure 4. Severe necrotizing pancreatitis (combined pancreatic and peripancreatic) in a 42-year-old male (CRP level of 253 mg/L, Ranson, BISAP, Marshall, APACHE II, CTSI, and EPIC of 5, 4, 18, 6, 6, and 3 points, respectively; positive for infection and organ failure while no procedure was done, no ICU admission, or death on this patient). Abdominal axial contrast-enhanced CT at the portal phase (A) showed there was a large amount of acute necrotic collection (ANC) around the pancreas. Axial chest image CT (B) showed there was a large amount of left pleural effusion.
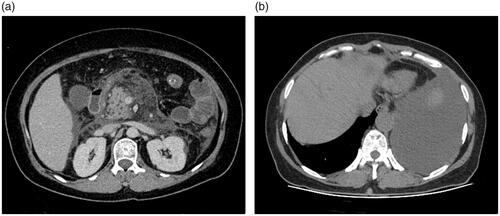
Table 3. Prevalence of pleural effusion in different level of C-reactive protein and scoring systems in 465 patients with acute pancreatitis.
Figure 5. Bar graph shows mean pleural effusion volume in millilitres (error bars = 95% CIs) for each clinical outcome. *p < .0001.
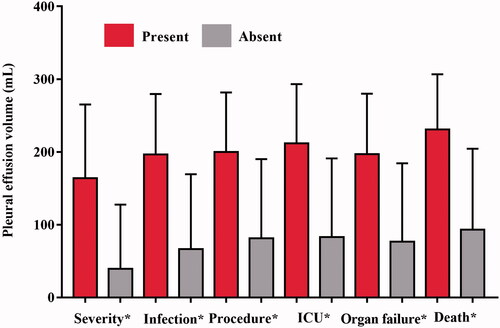
Table 4. The relationship between pleural effusion volume and C-reactive protein level, and different scoring systems in 465 patients with acute pancreatitis.
Table 5. Receiver operating characteristic curve analysis of pleural effusion volume, C-reactive protein and different scoring systems for predicating severity and clinical outcomes of acute pancreatitis in 465 patients.
Figure 6. Receiver operating characteristic curves (ROC) of the pleural effusion volume, C-reactive protein levels and different clinical scoring systems for predicting severe acute pancreatitis (A), infection (B), procedure (C), ICU admission (D), organ failure (E), and death (F).
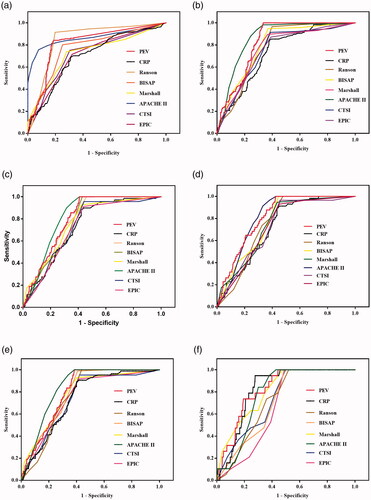
Table 6. Pairwise comparison of AUC of pleural effusion volume, C-reactive protein and different scoring systems in 465 patients with acute pancreatitis.
Data availability statements
The data related to the results of this study can be obtained from the first or corresponding author (GWY or YML) upon reasonable request.