
Figures & data
Figure 1. Flowchart of study selection based on the inclusion and exclusion criteria.
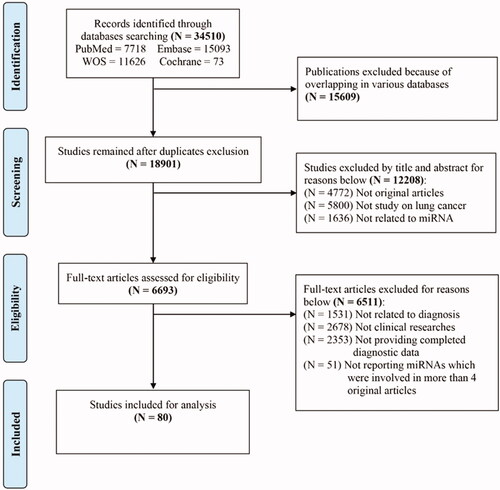
Figure 2. The characteristics for included miRNAs of involved articles. (a) The proportion of sample sources for researched single-miRNAs and miRNA panels miRNAs in all included articles. (b)The relationship between total reported miRNAs and LC subtypes. (c) The proportion of specimen sources among 20 included single-miRNAs. Tumour type: AD: adenocarcinoma; SCC: squamous cell carcinoma; SCLC: small cell lung carcinoma; NSCLC: non-small cell lung carcinoma. Sample sources: EBC: exhaled breath condensate; PB: peripheral blood; PBMCs: peripheral blood mononuclear cells; BALF: bronchoalveolar lavage; PLF: pleural lavage fluid.
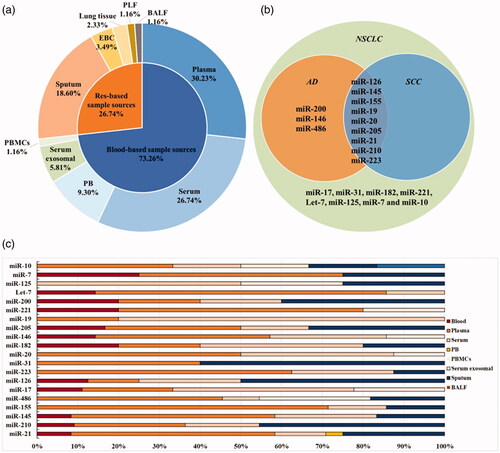
Table 1. The main features of eligible studies that related to the diagnosis of miRNA for LC.
Table 2. Detailed assessment of overall diagnostic value of 20 single-miRNAs in NSCLC.
Figure 3. The diagnostic value of several single-miRNAs in NSCLC between different sample sources. (a–d) The difference in diagnostic power of a certain miRNA between respiratory-based and blood-based samples for NSCLC (a–b) and early NSCLC (c–d) through comparison of sensitivity (a, c) and specificity (b, d). Colour in dark gray refers to respiratory-based samples while colour in light gray refers to blood-based samples.
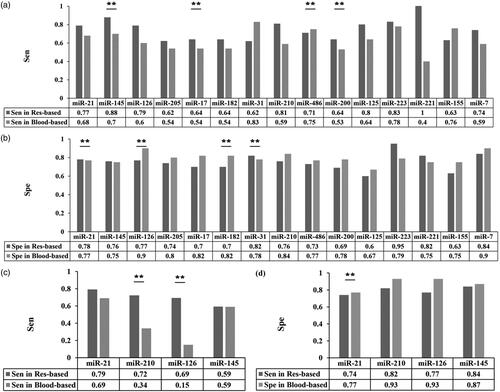
Table 3. The overall diagnostic value of single miRNAs in early NSCLC.
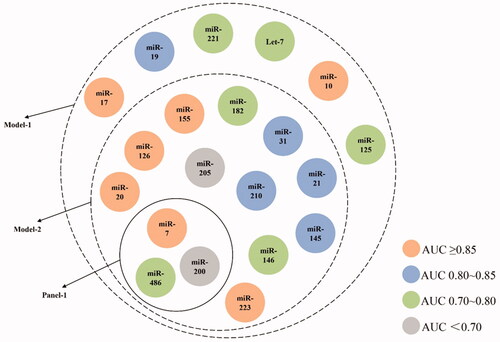
Figure 4. Containment relationship of analyzed single-miRNAs as different combined groups for NSCLC. The colour of each miRNA depends on their AUC value shown in . Panel-1contains three miRNAs (miR-21, -31, -210), Model-1 contains 20 miRNAs and Model-2 contains 14 miRNAs.
Supplemental Material
Download ()Data availability statement
The authors confirm that the data supporting the findings of this study are available within the article and its supplementary materials.