
Figures & data
Figure 1. Flowchart of participants. COVID-19: coronavirus disease 2019; SARS-CoV-2: severe acute respiratory syndrome coronavirus 2.
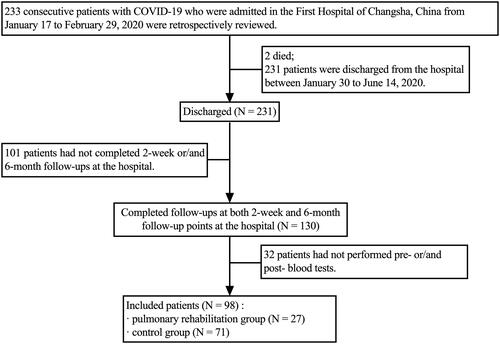
Table 1. Demographics and clinical characteristics of patients.
Figure 2. (A) Clinical symptoms in the COVID-19 patients during hospitalization; (B) changes in exercise capacity, severe acute respiratory syndrome coronavirus 2 (SARS-CoV-2) specific immunoglobulins, T lymphocytes and biochemical and haematological biomarkers in the COVID-19 patients during the 6-month convalescence period. COVID-19: coronavirus disease-19; SD: standard deviation; 95% CI: 95% confidence interval; 6-MWD: six-minute walk distance; WBC: white blood cells; CD3+: mature human T lymphocytes; CD4+: helper/inducer T lymphocytes; CD8+: suppressor/cytotoxic T lymphocytes; WBC: white blood cell; Lymph.: lymphocytes; Neu.: neutrophils; Eos.: eosinophils; ALT: alanine aminotransferase; AST: aspartate aminotransferase; BUN: blood urea nitrogen. *Any symptoms indicate if a patient has any of the following symptoms: fever, cough, fatigue, anorexia, sore throat, dyspnoea, myalgia, diarrhoea, headache and dizziness. †The value of relative change was calculated by the equation of (value of change/baseline value)×100. The absolute changes in variables during the 6-month convalescence period were assessed by paired t-test and Wilcoxon’s sign-rank test for normal and non-normal distribution variables, respectively.
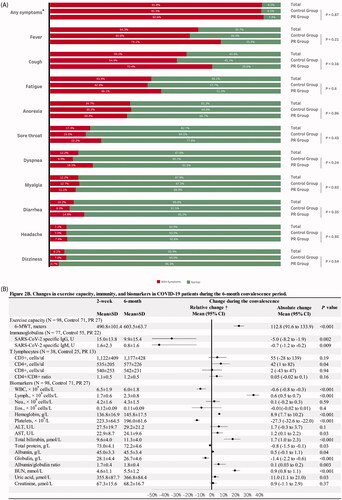
Table 2. The effects of pulmonary rehabilitation on exercise capacity, immunity and blood chemistry in COVID-19 patients during the 6-month convalescence period.
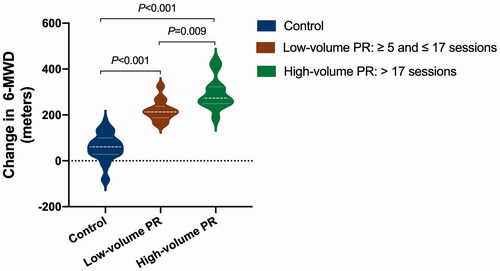
Figure 3. The effect of pulmonary rehabilitation on exercise capacity in COVID-19 patients during the 6-month convalescence period in a dose-dependent way. The difference between changes in 6-minute walk distance (6-MWD) across groups was assessed by analysis of covariance (ANCOVA) with a covariate of propensity score that adjusted for sex, age, body weight, baseline 6-MWD, physical activity per week during the 6-month recovery period, and COVID-19 classification, comorbidity and the use of antibiotics during hospitalization. Post hoc analysis for each comparison was also performed. The mean difference and 95% confidence interval in the high-volume pulmonary rehabilitation group vs. control group are 165 (101–229) m; low-volume vs. control is 88 (22–154); high-volume vs. low-volume is 77 (34–120), p values for each assessment are marked on the figure accordingly (N = 98, control 71, low-volume PR 14, high-volume PR 13).
Supplemental Material
Download ()Data availability statement
The data that support the findings of this study are available from the corresponding author, SL, upon reasonable request.