
Figures & data
Figure 1. The study protocol and patient flow diagram. (A) Study protocol. The study consisted of screening, remission-induction therapy, maintenance therapy, and proactive therapy periods. During the screening period, patients were followed-up with standard reactive treatment (emollient and TCS application). During the remission-induction therapy period, patients applied medium-high to high-potency TCS twice daily for 4–8 weeks to the affected area. The baseline was defined as the first visit more than 4 weeks after the initiation of induction therapy, and patients with a SCORAD score of less than 20 moved to the maintenance period, during which they applied TACo once daily for 4 weeks to the previously affected area. Patients who completed the maintenance therapy period without lesion exacerbation or severe adverse events were moved to the proactive therapy period, during which they applied TACo twice weekly to the previously affected area for 12 weeks. During the maintenance and proactive therapy periods, lesion exacerbation was defined as an increase in the SCORAD score of 1.5-fold compared with baseline. Patients dropped out if they needed to apply TCS for more than 14 days to flare-up lesions or if they discontinued TACo application by their own decision because the lesion was worsening. The exacerbated lesions were treated with TCS twice daily until remission was achieved. (B) Patient flow diagram. All 31 patients enrolled in the study completed the remission-induction period. Among them, 21 completed the maintenance therapy (TCI responders), while the remaining 10 dropped out (TCI non-responders). Of the 21 TCI responders, 13 completed the proactive therapy (proactive-completed group) and the remaining 8 dropped out (proactive-dropout group). Of the patients in the TCI non-responders, 6 (19.4%) exhibited a SCORAD score increase of more than 1.5-fold above baseline at the end of treatment, 2 (6.5%) withdrew at their discretion, and 2 (6.5%) used TCS for more than 14 days by the end of the maintenance period. In the proactive-dropout group, 6 (19.4%) patients used TCS for more than 14 days, and 2 (6.5%) exhibited a SCORAD score increase of more than 1.5-fold above baseline by the end of treatment.
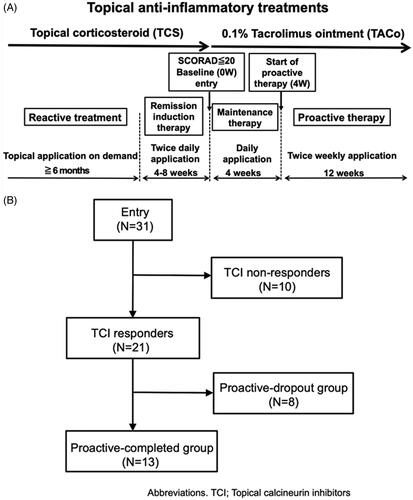
Table 1. Demographics of the patients at the baseline (n = 31).
Table 2. Demographics of the patients at the start of proactive therapy (n = 21).
Figure 2. Change in the mean SCORAD and mean relative SCORAD scores during the treatment. (A) Changes in the mean SCORAD score in each treatment group. The mean SCORAD scores at the beginning of the remission-induction period and baseline did not differ significantly among the three treatment response groups. At the beginning of the remission-induction period, the mean SCORAD score was 17.9 ± 8.3 in the TCI non-responders, 19.7 ± 7.1 in the proactive-completed group, and 21.2 ± 7.2 in the proactive-dropout group. At baseline, the mean SCORAD score was 12.0 ± 4.2 in the TCI non-responders, 12.7 ± 3.6 in the proactive-completed group, and 15.3 ± 3.4 in the proactive-dropout group (no significant difference: adjusted p > 0.05 in all pairwise comparisons). At the end of maintenance therapy, the mean SCORAD score was 21.4 ± 5.5 in TCI non-responders, 11.7 ± 4.6 in the proactive-completed group, and 16.6 ± 4.2 in the proactive-dropout group (significantly different between the proactive-completed and proactive-dropout group; p = 0.025). At the last visit for proactive therapy, the mean SCORAD score was 9.8 ± 2.9 in the proactive-completed group and 22.4 ± 6.1 in the proactive-dropout group. (B) Changes in the mean relative SCORAD score in each treatment response group. The ratio of the SCORAD score at each visit relative to the baseline SCORAD score was calculated for each patient, and the changes in their mean values are shown. At the beginning of the remission-induction period, the mean relative SCORAD score was 1.64 in the TCI non-responders, 1.56 in the proactive-completed group, and 1.36 in the proactive-dropout group. At the end of maintenance therapy, the mean relative SCORAD score was 2.04 in the TACo-dropout group, 0.91 in the proactive-completed group, and 1.11 in the proactive-dropout group. At the last visit for proactive therapy, the mean SCORAD score was 0.82 in the proactive-completed group and 1.4 in the proactive-dropout group.
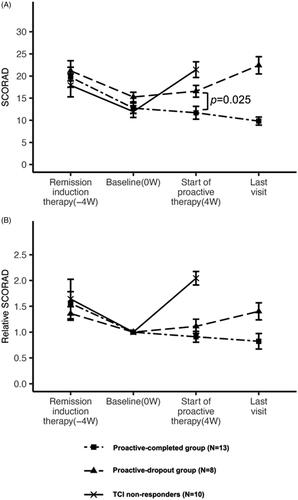
Figure 3. Laboratory marker levels according to the treatment outcome. Serum IgE, LDH and TARC levels, and peripheral eosinophil count were analysed at baseline and the beginning of the proactive therapy period. The correlations between these levels and the clinical outcomes of AD patients after TACo maintenance and proactive therapy were evaluated. (A) Laboratory marker levels between the TCI responders and TCI non-responders at baseline. The mean serum IgE level was significantly higher (p = 0.049) in the TCI responders (5126.5 ± 4718.3 IU/mL) than in non-responders (2500.9 ± 2283.1 IU/mL). In contrast, the other biomarkers were not significantly different. The mean LDH level at baseline was 233.7 ± 50.5 U/L in the TCI responders and 217 ± 29.6 U/L in the TCI non-responders (p = 0.257). The mean TARC level was 1469.7 ± 1193.9 pg/ml in the TCI responders and 1243.6 ± 911.5 pg/ml in the TCI non-responders (p = 0.566). The mean eosinophil count was 408 ± 272.7/μL in the TCI responders and 365.8 ± 181/μL in the TCI non-responders(p = 0.614). (B) Laboratory marker levels between the proactive-completed and proactive-dropout groups at the start of the proactive therapy period. Mean LDH and TARC levels and eosinophil count significantly differed between the proactive-completed and proactive-dropout groups. More specifically, the mean LDH level at the start of proactive therapy was 232.3 ± 50.8 U/L in the proactive-completed group and 275.9 ± 31.3 U/L in the proactive-dropout group (p = 0.029). The mean TARC level was 902.5 ± 638.8 pg/ml in the proactive-completed group and 3220.8 ± 2162.5 pg/ml in the proactive-dropout group (p = 0.019). The mean eosinophil count was significantly lower (p < 0.01) in the proactive-completed group (356.8 ± 193.4/μL) than in the proactive-dropout group (752.1 ± 315.1/μL). In contrast, the mean serum IgE level did not differ significantly (p = 0.165) between the proactive-completed group (3634.2 ± 2680.5 IU/mL) and the proactive-dropout group (7821.3 ± 7465 IU/mL).
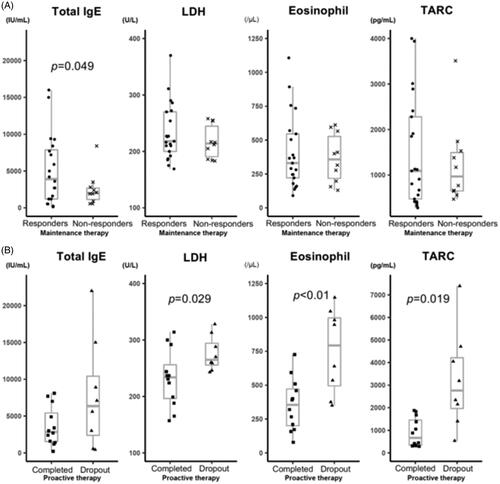
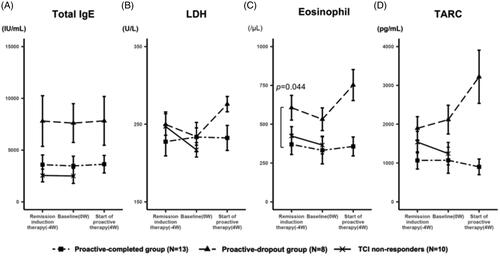
Figure 4. Change in the level of laboratory markers during the treatment. (A) The transition of the mean serum IgE levels. At the start of remission induction therapy, the mean IgE levels were 3588.3 ± 2962 IU/mL, 7801.4 ± 7736.7 IU/mL, and 5140.5 ± 5447.3 IU/mL in the proactive-completed, proactive-dropout, and TCI non-responders, respectively (p = 0.21; between proactive-completed and proactive-dropout groups). The mean IgE levels of each group were similar throughout the study, regardless of the treatment regimen or response. (B) The transition of the mean serum LDH levels. At the start of remission induction therapy, the mean LDH levels were 227.5 ± 58.3 U/L and 249.6 ± 44 U/L in the proactive-completed and proactive-dropout groups, respectively (p = 0.34). During the remission induction therapy period, LDH levels decreased in the proactive-dropout group and slightly increased in the proactive-completed group. During the maintenance therapy period, LDH levels increased markedly in the proactive-dropout group while slightly decreasing in the proactive-completed group. (C) The transition of the mean eosinophil count in peripheral blood. At the start of remission induction therapy, the mean eosinophil count was 369.8 ± 204.9/μL and 606.3 ± 251.9/μL in the proactive-completed and proactive-dropout groups, respectively (p = 0.044). During the remission induction therapy period, eosinophil count decreased in both proactive-dropout and proactive-completed groups. During the maintenance therapy period, eosinophil count markedly increased in the proactive-dropout group and slightly increased in the proactive-completed group. (D) The transition of the mean serum TARC levels. At the start of remission induction therapy, the mean TARC levels were 1068.2 ± 701 pg/mL and 1894.8 ± 947.7 pg/mL in the proactive-completed and proactive-dropout groups, respectively (p = 0.056) . During the remission induction therapy period, TARC levels increased in the proactive-dropout group and about the same in the proactive-completed group. During the maintenance therapy period, TARC levels further increased in the proactive-dropout group while decreased in the proactive-completed group.
Supplemental Material
Download ()Data availability statement
The authors confirm that the data supporting the findings of this study are available within the article [and/or] its Supplementary materials.