
Figures & data
Figure 1. Flowchart of the identification of eligible trials.
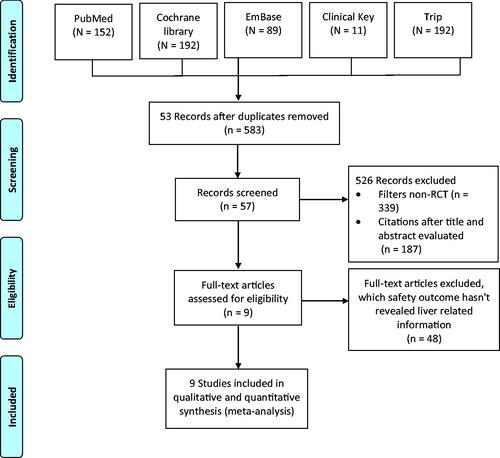
Table 1. Summary and baseline data of patients in included studies [Citation1,Citation3,Citation4,Citation10–14].
Figure 2. Risk of bias of available studies in meta-analysis.
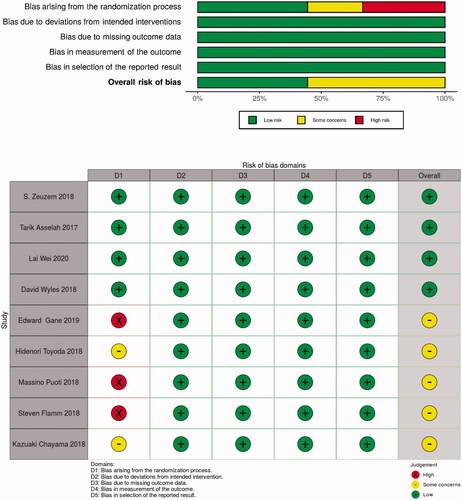
Figure 3. Funnel plot for event rate.
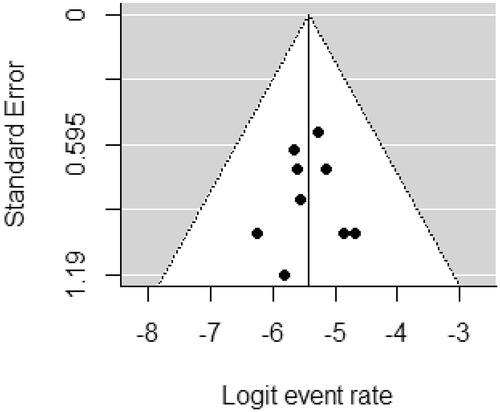
Figure 4. Describes forest plots of Grade 3 adverse events of incidence DILI of glecaprevir plus pibrentasvir. (A) AST, (B) ALT, (C) T-Bil, and (D) Haemoglobin. 95% CI: confidence interval.
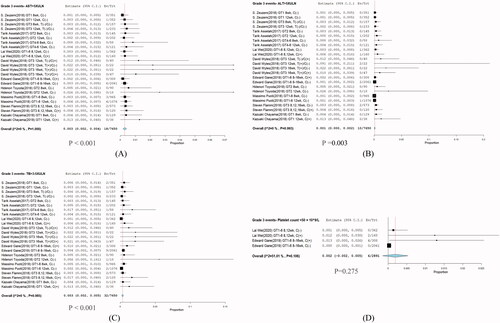
Figure 5. Presents forest plots of laboratory abnormalities were evaluated as Grade 2 adverse of glecaprevir plus pibrentasvir. (E) AST, (F) ALT, (G) T-Bil, and (H) haemoglobin. Incidence DILI with 95% CI. CI: confidence interval.
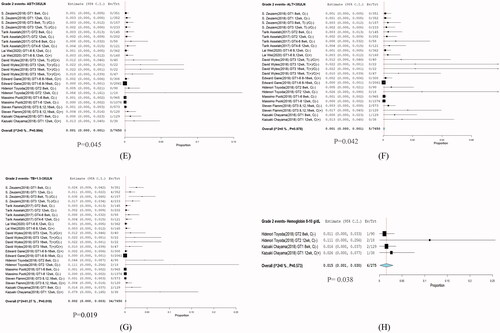
Figure 6. Subgroup analysis in grade 3 hyperbilirubinemia. (I) Without cirrhosis, (J) with cirrhosis (K), treatment for 8 weeks (L), and treatment for >12 weeks.
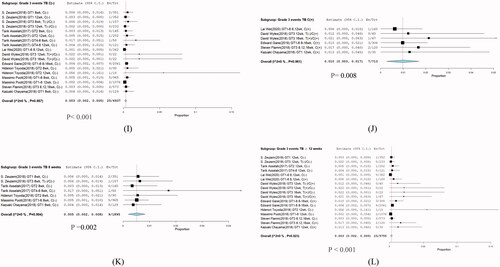
Figure 7. Subgroup analysis in grade 3 hyperbilirubinemia of HCV infection different genotypes. (GT), (M) GT1, (N) GT2, (O) GT3, and (P) GT1-6.
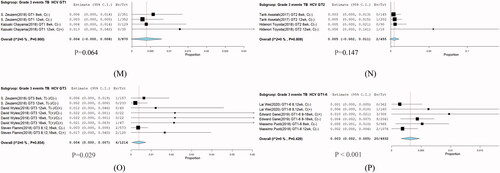
Table 2. Summary of laboratory abnormalities [Citation1–3,Citation9–14].
Figure 8. Subgroup analysis in grade 3 events between without cirrhosis and cirrhosis group. (Q and R) ALT (S and T) AST.
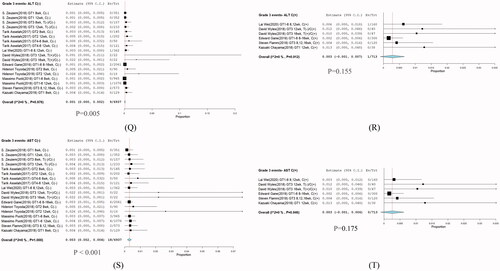
Figure 9. Meta-analysis forest plots of glecaprevir/pibrentasvir for chronic HCV infection posttreatment 12 weeks sustained virologic response rates (SVR12).
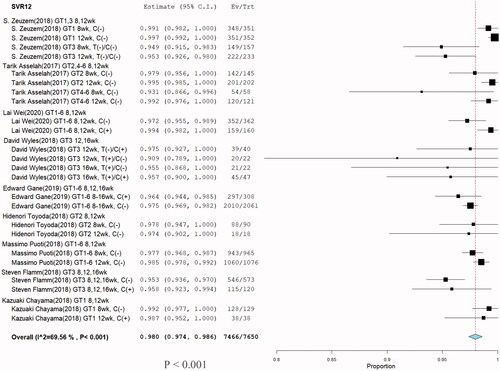
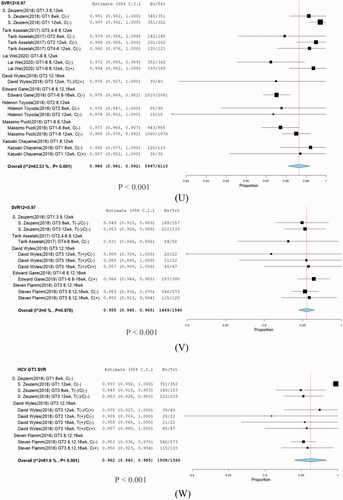
Figure 10. Subgroup analysis in stratification SVR rate. (U) SVR > 97%, (V) SVR < 97%, and (W) HCV GT3.
Supplemental Material
Download MS Word (31.5 KB)Data availability statement
No data are available in this study.