
Figures & data
Figure 1. Enrolment criteria and clinicopathological data of 196 ESCC patients.
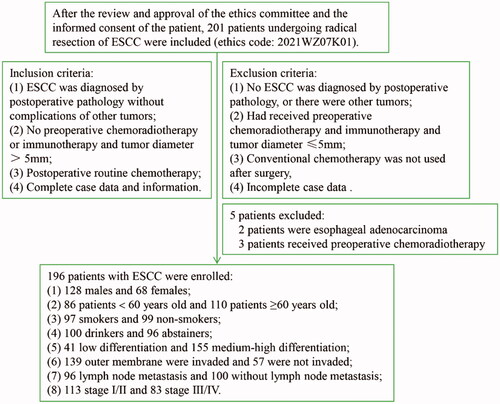
Figure 2. Fn can induce KIR2DL1 expression on CD8+ T cells. (A) The expression of KIR2DL1 on CD8+ T cells was detected by flow cytometry; (B) The expression of KIR2DL1 on CD8+ T cells among the groups at each time point was compared by one-way ANOVA; (1) Compared with the CD8+ T cells group, p < .05; (2) Compared with the CD8+ T cells + KYSE150 cells group, p < .05; (3) Compared with the CD8+ T cells + Fn group, p < .05.
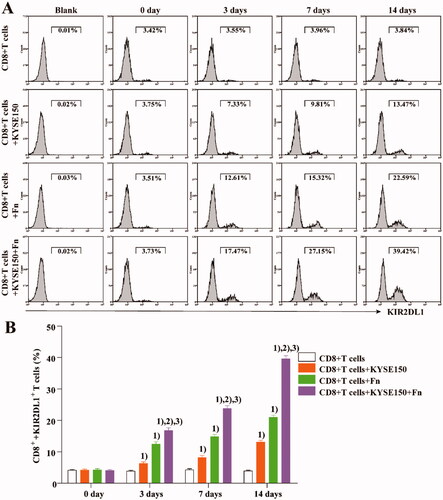
Figure 3. Fn infection can reduce the sensitivity of tumour cells to CDDP. (A) Apoptosis of KYSE150 cells in the co-culture system was detected by flow cytometry; (B) The apoptosis rate of KYSE150 cells was different among all groups; (C) Differences in tumour size and fluorescence intensity among groups; (D) Differences in tumour weight among groups; (1) Compared to the control group, p < .05; (2) Compared with the Fn group, p < .05; (3) Compared with the CDDP group, p < .05. (E) In vivo imaging was used to measure the tumour size in each mouse group.
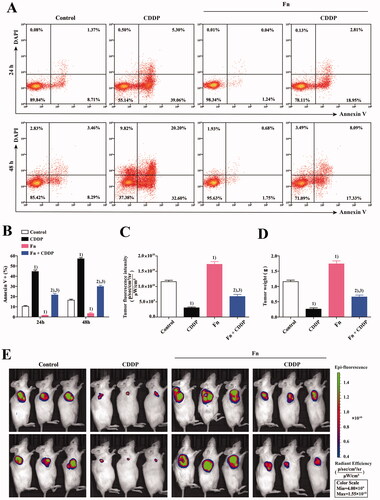
Figure 4. Fn infection and KIR2DL1 expression on the surface of CD8+ T cells in ESCC and adjacent tissues (400×). (A,D,G) Representative RNAscope images of Fn infection (16S rRNA); (B,E,H) Representative immunohistochemical images of CD8+ T cell infiltration; (C,F,I) Representative immunohistochemical images of KIR2DL1 expression.
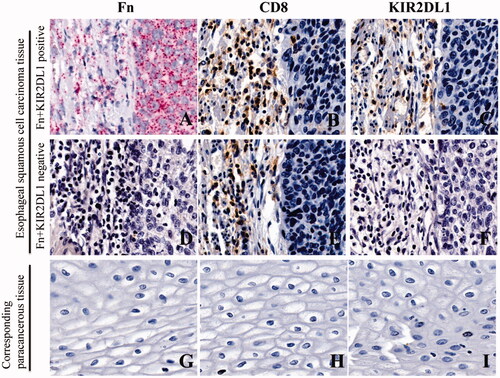
Table 1. Cohen's kappa coefficients indicate the consistency between Fn infection and expression of the inhibitory receptor KIR2DL1 on the surface of CD8+ T lymphocytes in ESCC [n (%)].
Table 2. Comparison of the positive rates of Fn infection in cancer tissues and corresponding adjacent tissues of patients with ESCC [n (%)].
Table 3. Comparison of KIR2DL1 expression on the surface of CD8+ T cells in ESCC tissues and the corresponding paracancerous tissues [n (%)].
Table 4. Correlation between positivity for Fn-induced expression of the inhibitory receptor KIR2DL1 on the surface of CD8+ T lymphocytes and clinicopathological features of patients with ESCC [n (%)].
Table 5. Cox regression analysis of prognostic factors in patients with lung adenocarcinoma.
Figure 5. (A) Kaplan–Meier survival curve of patients with ESCC 5 years after surgical resection; (B) Kaplan–Meier 5-year survival curve of ESCC patients positive and negative for Fn-induced expression of the inhibitory receptor KIR2DL1 on the surface of CD8+ T lymphocytes.
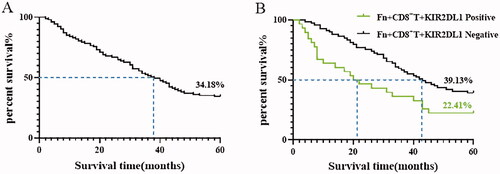
Table 6. Mean and median survival times (months) of ESCC patients positive for Fn-induced expression of the inhibitory receptor KIR2DL1 on the surface of CD8+ T lymphocytes.
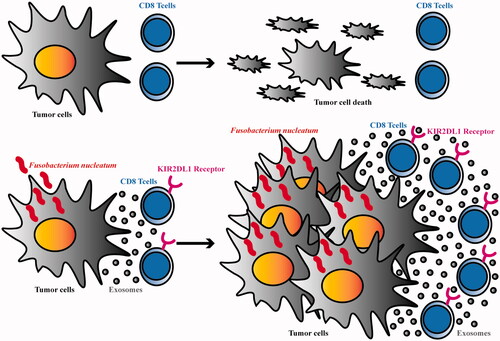
Figure 6. Schematic diagram.
Data availability statement
The data that support the findings of this study are available on request from the corresponding author. The data are not publicly available due to privacy or ethical restrictions.