
Figures & data
Figure 1. Structure of network formed by interventions. The lines between treatment nodes indicate the direct comparisons made within randomized controlled trials. The solid line means direct comparisons and the dashed line means indirect comparisons. (A) Main network meta-analysis. (B) Subgroup analysis.
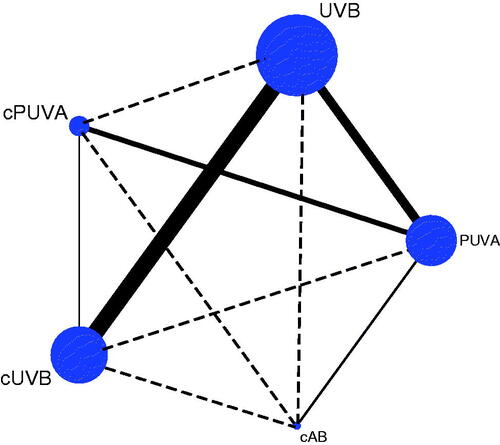
Table 1. Detailed results of main network analysis.
Table 2. The league plots of main network meta-analysis (from the top left to the bottom right, higher comparator vs. lower comparator).
Figure 2. Forest plots incorporated direct comparisons and indirect comparisons of main network meta-analysis. (1) PASI 75 response. (2) PASI 75 and above response. (3) Absolute PASI improvement. (4) Withdrawal due to AEs. (5) Incidence of erythema. (A: PUVA; B: UVB; C: cPUVA; D: cUVB; E: cAB).
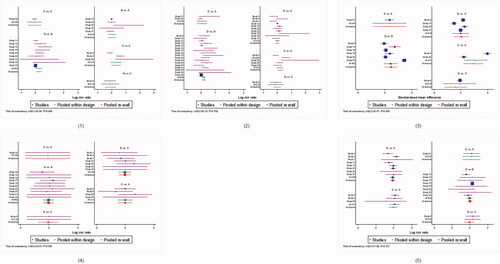
Figure 3. Forest plots of network comparisons of main network meta-analysis. (1) PASI 75 response. (2) PASI 75 and above response. (3) Absolute PASI improvement. (4) Withdrawal due to AEs. (5) Incidence of erythema.
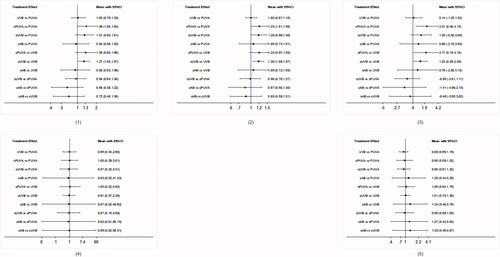
Table 3. Detailed results of subgroup analysis.
Data availability statement
Data generated or analysed during this study are included in this published article. The datasets generated during and/or analysed during this study are available from the corresponding author on reasonable request.