
Figures & data
Figure 1. HLH-2004 diagnostic criteria.
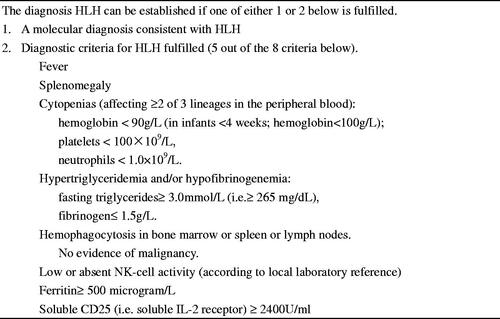
Figure 2. Diagram of enrolled patients.
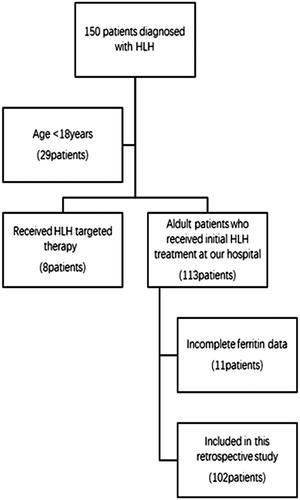
Table 1. General information and laboratory indicators of the included patients.
Table 2. Multivariate analyses of factors which affect the response of induction therapy.
Table 3. Ferritin and response to induction therapy.
Figure 3. Comparison of AUC of ferritin in predicting induction response.
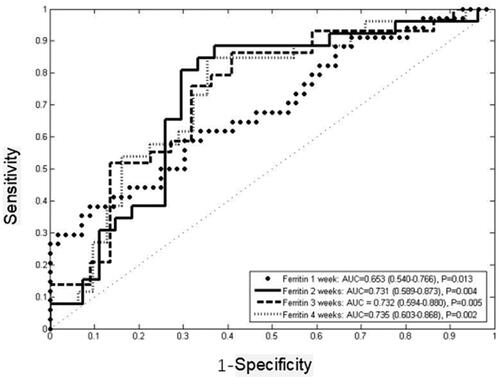
Table 4. Ferritin for predicting induction response.
Table 5. Ferritin for predicting survival.
Figure 4. Response stratified by ferritin cut-off post-therapy initiation at: (A) one week (p = 0.552, HR = 1.194, 95%CI 0.665–2.143); (B) two weeks (p = 0.003, HR = 0.156, 95%CI 0.047–0.521); (C) three weeks (p = 0.008, HR = 0.238, 95%CI 0.082–0.686); (D) four weeks (p = 0.003, HR = 0.193, 95%CI 0.066–0.563).
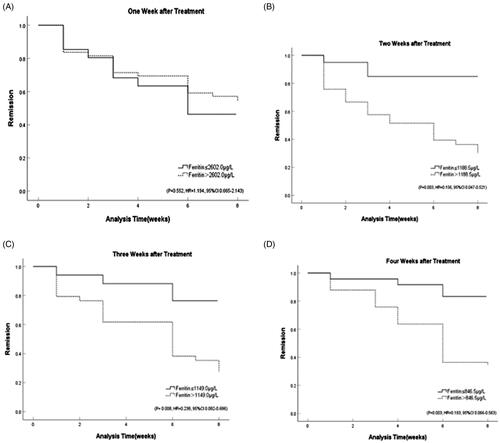
Figure 5. Comparison of AUC of ferritin in predicting survival.
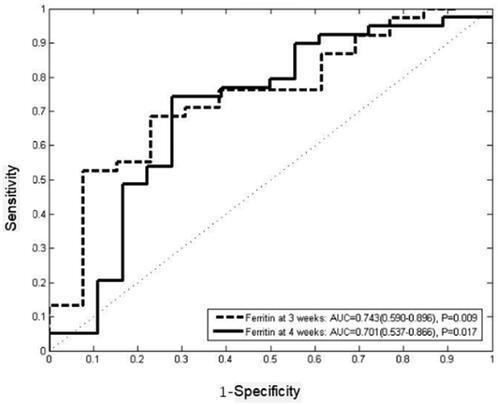
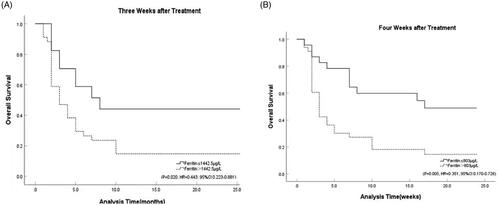
Figure 6. The survival curve for ferritin. (A) The survival curve for ferritin at 3 weeks after treatment (p = 0.020, HR = 0.443, 95%CI 0.223–0.881). (B) The survival curve for ferritin at 4 weeks after treatment (p = 0.005, HR = 0.351, 95%CI 0.170–0.726).
Data availability statement
The datasets used during the current study are available from the corresponding author on request.