
Figures & data
Table 1. Therapeutic effect observation table.
Figure 1. Analysis flowchart. ITT: intention-to-treat; mITT: modified intention-to-treat; PP: per-protocol.
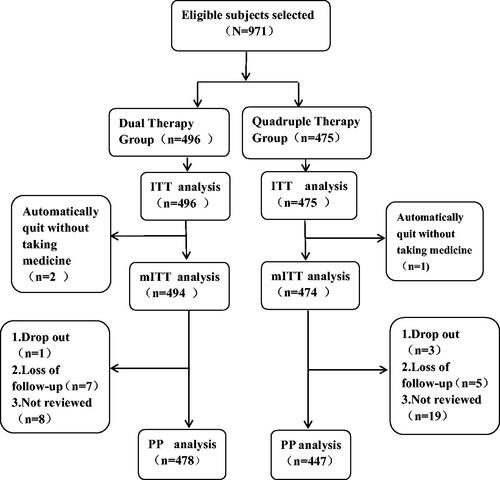
Table 2. Demographic characteristics and symptom score.
Table 3. Eradication rate of H. pylori.
Table 4. Adverse events.
Data availability statement
The data that support the findings of this study are available on request from the corresponding author. The data are not publicly available due to privacy or ethical restrictions.