
Figures & data
Figure 1. Meta-analysis flow chart of included and excluded studies.

Table 1. Characteristics of included studies.
Figure 2. Forest plot of resuscitation outcomes: prehospital ROSC, survival to discharge, good CPC outcome. The centre of each square represents the weighted odds ratios for individual trials, and the corresponding horizontal line stands for 95% CI. The diamonds represent pooled results. C-DACPR: conventional audio-instructed dispatcher-assisted bystander cardiopulmonary resuscitation; V-DACPR: video-instructed dispatcher-assisted bystander cardiopulmonary resuscitation; M–H:? ??; CI: confidence interval; ROSC: return of spontaneous circulation; CPC: Cerebral Performance Categories Scale.
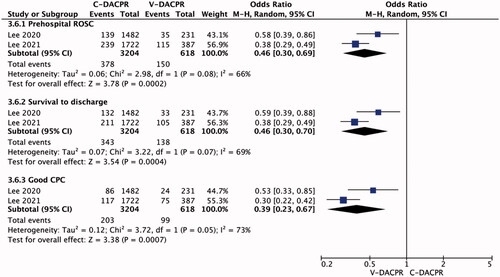
Table 2. Characteristics of patients with out-of-hospital cardiac arrest involved in the analysed studies.
Figure 3. Forest plot for chest compression rate in the C-DACPR and V-DACPR groups. The centre of each square represents the weighted odds ratios for individual trials, and the corresponding horizontal line stands for 95% CI. The diamonds represent pooled results. C-DACPR: conventional audio-instructed dispatcher-assisted bystander cardiopulmonary resuscitation; V-DACPR: video-instructed dispatcher-assisted bystander cardiopulmonary resuscitation; SD: standard deviation; CI: confidence interval.
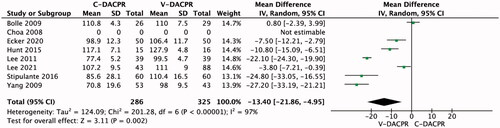
Table 3. Results of the simulation trials.
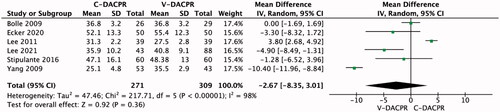
Figure 4. Forest plot for chest compression depth in the C-DACPR and V-DACPR groups. The centre of each square represents the weighted odds ratios for individual trials, and the corresponding horizontal line stands for 95% CI. The diamonds represent pooled results. C-DACPR: conventional audio-instructed dispatcher-assisted bystander cardiopulmonary resuscitation; V-DACPR: video-instructed dispatcher-assisted bystander cardiopulmonary resuscitation; SD: standard deviation; CI: confidence interval.
Data availability statement
The data will be made available on request from the corresponding author.