
Figures & data
Table 1. Body weight, body mass index, levels of glucose, diameter of ovary, weight of ovary, diameter of ovary.
Table 2. Thickness of peripheral granulosa, theca layer of secondary, tertiary and cystic follicles.
Table 3. The number of ovarian follicles (mean ± SEM).
Figure 1. Histological analysis of various ovarian follicles in PCOS induced and control rats. (A) Primordial follicle showing flat layer of granulosa cells (GC) along with oocytes (O) at ×40. (B) Primary follicles with well-defined oocyte ×40. (C) Secondary follicle having fluid and defined oocyte ×40. (D) Tertiary follicle having theca (T), granulosa cells (GC) and antrum (A) ×40. (E) Graffian follicle having a huge antrum, oocyte, corona radiate (CR) and zona pellucida (ZP) ×40. (F) Cystic follicle showing a huge antrum devoid of oocyte. All images were captured at ×40.
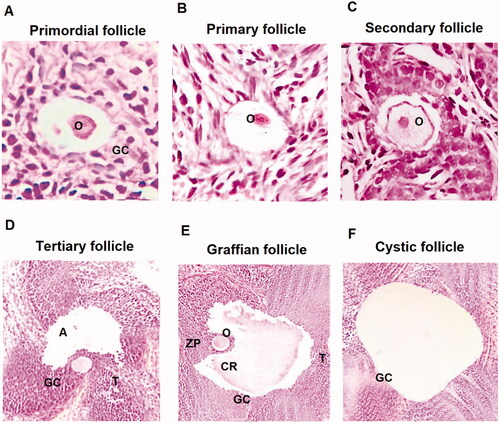
Figure 2. Cross sections of ovaries of rats of PCOS, control, metformin and Apigenin treated groups. (A) Cross section of ovarian tissue of control rats showing ovarian follicles along with primary follicles. (B) Ovarian tissues of PCOS rats showing various follicles. (C) Ovaries of MTF treated rats. (D) Ovaries of Apigenin treated rats.
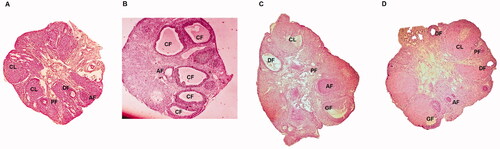
Table 4. Biochemical parameters.
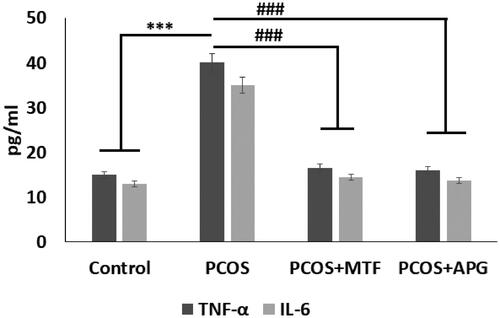
Figure 3. Elisa analysis of inflammatory cytokines in different treatment groups. ***p < .001 compared to control, ###p < .001 compared to PCOS group.
Data availability statement
Data will be made available on reasonable request to corresponding author.