
Figures & data
Figure 1. Course layout for the three configurations. Configuration A represents the ANPT OM CPG recommended course, configuration B represents the ATS recommended course, and configuration C represents a course layout from which configuration A was adapted.
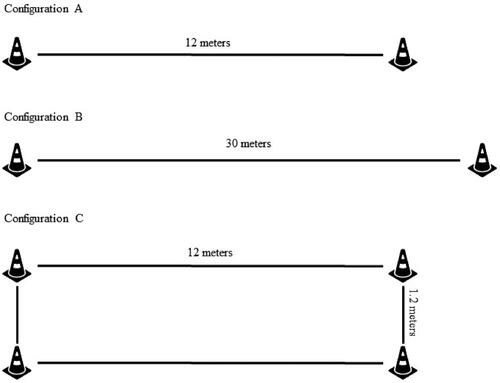
Figure 2. Mean walking distance comparison between methods of measurements during three 6 Minute Walk Test configurations. Note: each comparison was a statistically significant difference (p<.001). A = 12-meter straight walkway; B = 30-meter straight walkway; C = 1.2-meter by 12-meter rectangular walkway; Calc: mathematical calculation; Wheel: measuring wheel.
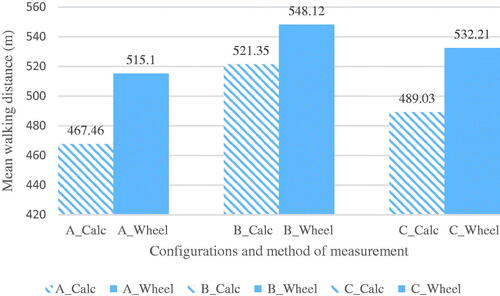
Table 1. Standardized instructions.
Table 2. Mean difference between two methods of measurements during three 6MWT course configurations.
Table 3. Pairwise comparisons of three 6MWT course configurations using two different methods of measurements.
Data availability statement
The data that support the findings of this study are openly available in Figshare at https://doi.org/10.6084/m9.figshare.18737438.v1