
Figures & data
Table 1. Demographic and clinical characteristics for 90-day mortality.
Figure 1. Predicted probability of death and observed distribution of patients across score value of NEWS for 1-day (A) and 90-day mortality (B) and qCSI for 1-day (C) and 90-day mortality (D). The grey area of the trend line corresponds to 95% confidence interval of the predicted probability of death (trend line). The bars correspond to the number of patients alive (grey) or dead (black) in the training cohort. The values within parenthesis refer to the range of score values included in each bar.
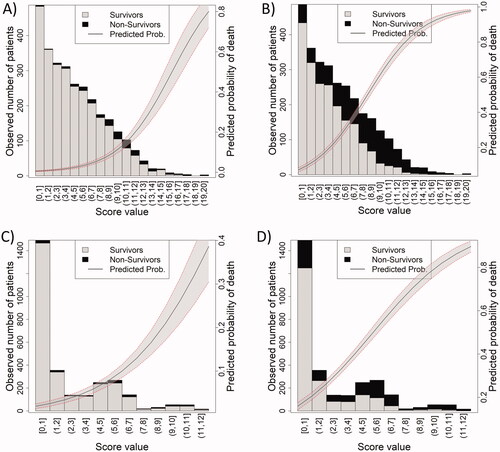
Figure 2. Predictive validity results of each model. Decision curve analysis for 1-day (A) and 90-day mortality (C) and the area under the receiver operating characteristic (ROC) curves for 1-day (B) and 90-day mortality (D) of qCSI and NEWS. Grey line corresponds to qCSI results and the black line to NEWS results.
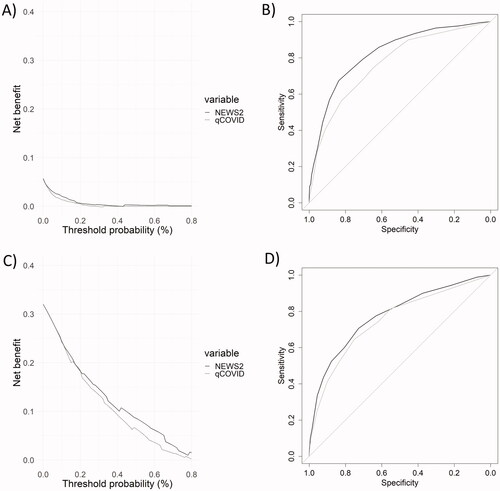
Table 2. Predictive validity of qCSI and NEWS for different mortality time points.
Table 3. Statistical details of the qCSI and NEWS for different point times analyzed.
Supplemental Material
Download Zip (1.3 MB)Data availability statement
Data are available upon a reasonable request to the corresponding author in https://figshare.com/s/445db8346441bd09aba3.