
Figures & data
Table 1. Demographics of the study participants who had common cold during May 2018 to February 2019 visited Guangdong provincial hospital of Chinese medicine, China.
Table 2. The WURSS-24-C item and summary descriptive statistics.
Figure 1. The 4-domains model fit confirmatory factor analysis (CFA) for the WURSS-24-C. Chi-square = 1673.47, df = 203, p value = .0000. GFI: goodness of fit index; AGFI: adjusted goodness of fit index; NNFI: non-normed fit index; CFI: comparative fit index; SRMR: standardized root mean square residual; RMSEA: root mean square error of approximation.
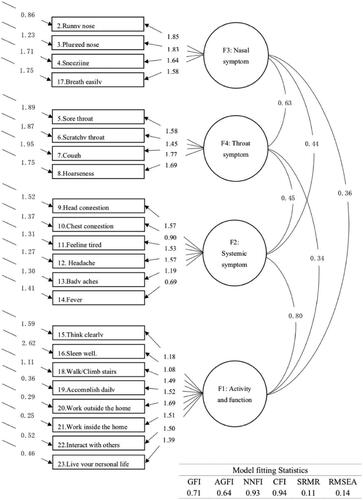
Table 3. The factor loading of WURSS-24-C items.
Figure 2. The average daily score of WURSS-24-C and SF-8 from Day 1 to 14. Sample size diminishes as participants’ colds resolve, from N = 300 on Day 1 to N = 27 on Day 14. The centre of the notched boxes is the median summed score for that day. The top of the notched boxes indicates the 25 and 75% percentiles, respectively. The notches portray the median ±1.57 (interquartile range = IQR)/N−2 and thus can be compared to assess difference at the p = .05 level of significance. The ends of the vertical lines indicate the last actual data point within 1.5 (IQR) from the 25%ile and 75%ile. The symbols above and below these lines are actual outlying data points.
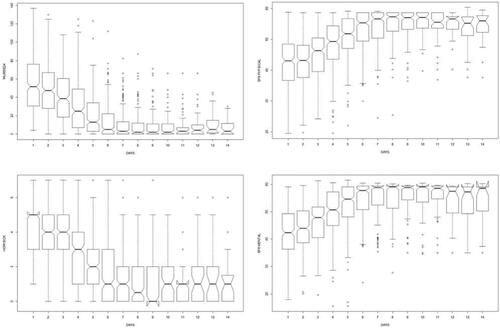
Figure 3. The scatterplot correlations of the WURSS-24-C with SF-8. Data shown represent Days 2–4, where sample size was N = 300, N = 300 and N = 298, respectively. The WURSS-24 correlated more statistically with physical than mental health, yielding Pearson correlation coefficient of −0.780 for SF-8 physical health and −0.721 for SF-8 mental health.
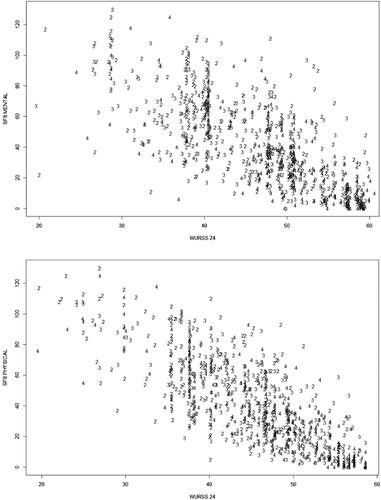
Table 4. Frequency, severity and minimal important difference of WURSS-24 Items.
Supplemental Material
Download MS Word (363.6 KB)Data availability statement
The datasets generated or analysed during this study are not publicly available due to limitations of ethical approval involving the patient data and anonymity but are available from the corresponding author on reasonable request.