
Figures & data
Table 1. The gradient detection method of HPLC.
Table 2. The doses and schedules of the agents of the Hyper-CVAD + RTX group.
Figure 1. Phase solubility diagram of PM/HP-β-CD system.
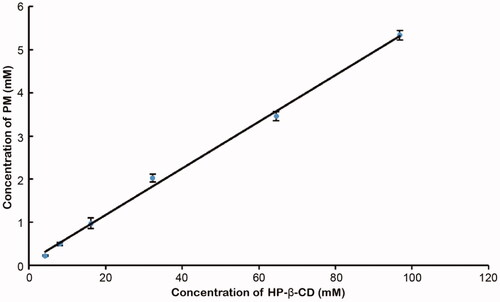
Figure 2. Computer molecular simulation of PM and HP-β-CD.
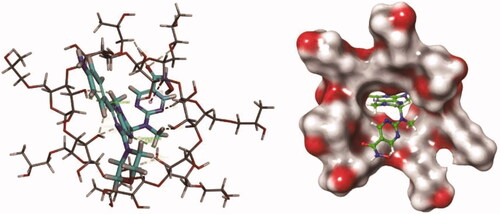
Figure 3. FT-IR spectra of PM, HP-β-CD, PM/HP-β-CD and the physical mixture (1:1 molar ratio).
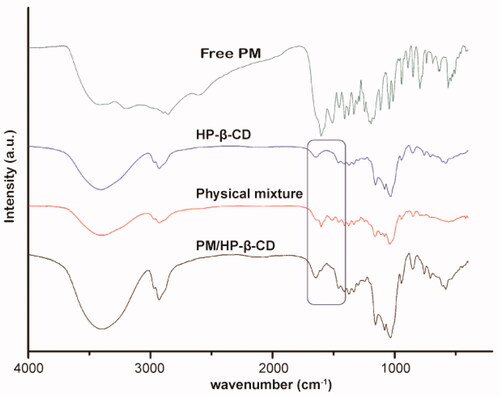
Figure 4. Scanning electron microphotographs of PM, HP-β-CD, the physical mixture (1:1 molar ratio), and PM/HP-β-CD.
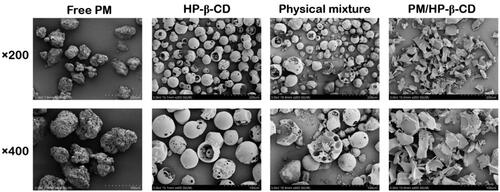
Figure 5. 1H-NMR spectra and chemical structural formula of PM, HP-β-CD, PM/HP-β-CD and the physical mixture (1:1 molar ratio).
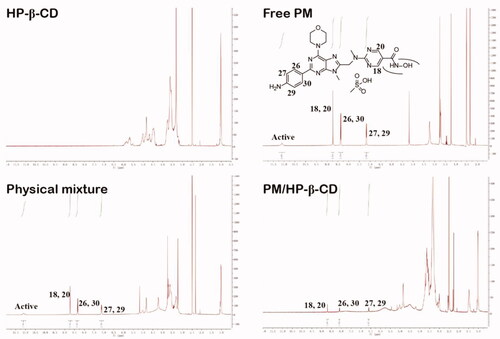
Table 3. Chemical shift (δ, ppm) change values relating to the signals of PM in different states.
Figure 6. In vitro antitumour effect. (A) Free PM and PM/HP-β-CD induced apoptosis in SU-DHL-6 cells. (B) A histogram of apoptosis data. (C) Cell viability of free PM and PM/HP-β-CD on SU-DHL-6 cells.
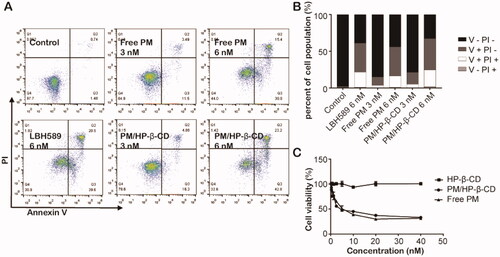
Figure 7. In vivo anti-tumour effect in SU-DHL-6 xenograft subcutaneous tumour model. (A) Growth curve of the tumour. (B) Bodyweight of the mice in each group. (C) Tumour weight of each group. (D) Survival curve of each group during survival investigation. (E) Tumour growth curves in each group during survival investigation. (F) Photographs of subcutaneous tumours in each group.
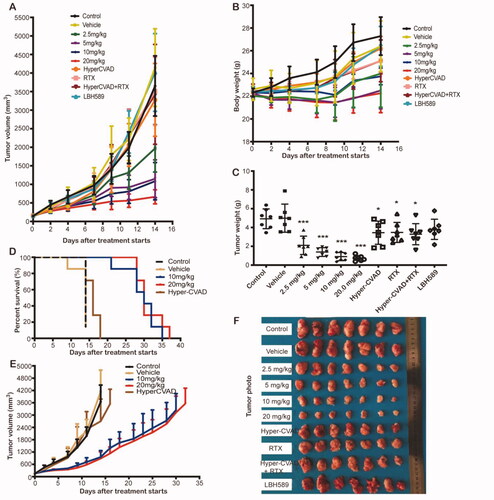
Table 4. Antitumour effects of PM/HP-β-CD in human double-hit lymphoma SU-DHL-6 xenograft tumours.
Table 5. Effect of PM for Injection on median survival of subcutaneously transplanted mice with human Burkitt's lymphoma Raji cell line.
Table 6. Pharmacokinetic parameters of oral administration and intravenous administration PM solution at a dose of 10 mg/kg.
Supplemental Material
Download Zip (5.4 MB)Data availability statement
The authors confirm that the data supporting the findings of this study are available within the article and its supplementary materials.