
Figures & data
Figure 1. Incidence of PLFGT from 1975 to 2017 adjusted to the 2000 standard US: (A) All patients; (B) DLBCL patients.
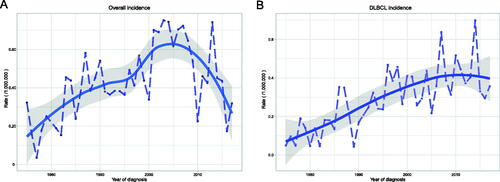
Table 1. Incidence rate from 1975 to 2017.
Table 2. Baseline demographic and clinical characteristics of patients.
Table 3. Patient characteristics according to the histological subtypes.
Table 4. Patient characteristics according to the primary sites.
Table 5. Percentage of different subtypes among the primary sites.
Figure 2. Survival analysis of PLFGT for all patients: (A) OS; (B) DSS.
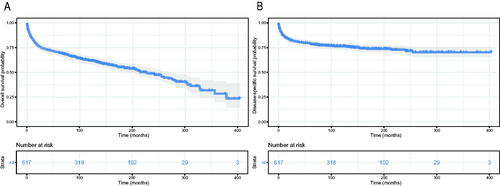
Figure 3. Survival analysis of PLFGT according to years of diagnosis: (A) OS; (B) DSS.
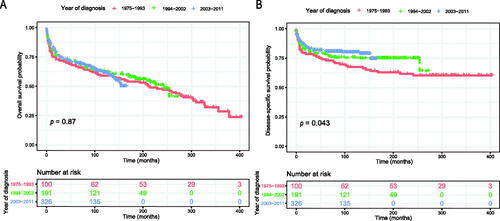
Figure 4. Overall survival of PLFGT according to (A) age, (C) race, and (E) marital status. Disease-specific survival of PLFGT according to (B) age, (D) race, and (F) marital status.
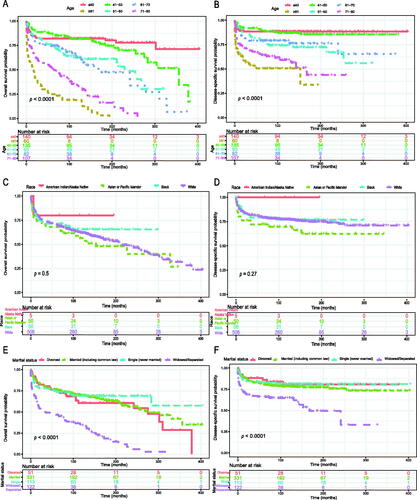
Figure 5. Overall survival of PLFGT according to (A) primary site, (C) histological type and (E) Ann Arbor Stage. Disease-specific survival of PLFGT according to (B) primary site, (D) histological type and (F) Ann Arbor Stage.
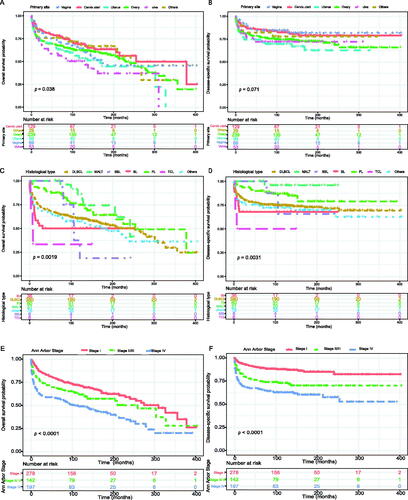
Figure 6. Survival analysis of PLFGT according to treatment strategy: (A) OS; (B) DSS.
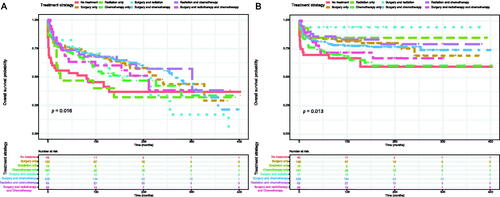
Table 6. Multivariable Cox regression analysis of OS and DSS for all patients.
Figure 7. Nomograms to predict (A) overall survival and (B) disease-specific survival for patients with PLFGT.
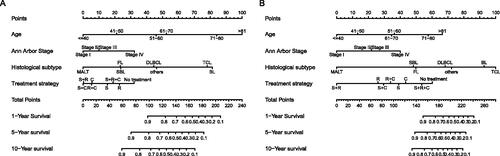
Figure 8. Calibration curves of the nomogram for 1-,5-, and 10-year overall survival of all patients in training set (A) and validation set (B), and calibration curves of the nomogram for 1-,5-, and 10-year disease-specific survival of all patients in training set (C) and validation set (D).
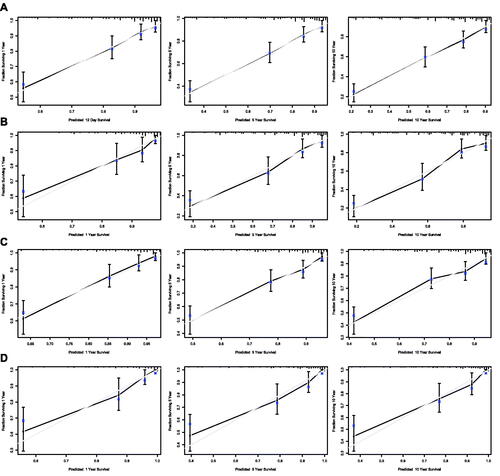
Figure 9. Nomograms to predict (A) overall survival and (B) disease-specific survival for patients with DLBCL.
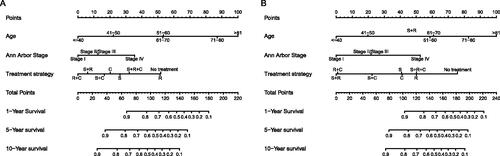
Figure 10. Calibration curves of the nomogram for 1-,5-, and 10-year overall survival of DLBCL patients in training set (A) and validation set (B), and calibration curves of the nomogram for 1-,5-, and 10-year disease-specific survival of DLBCL patients in training set (C) and validation set (D).
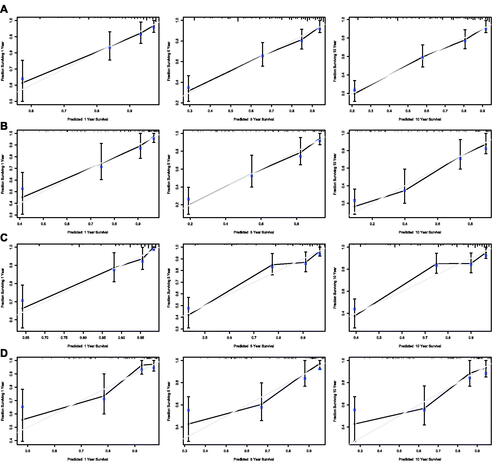
Table 7. Multivariable Cox regression analysis of OS and DSS for all patients.
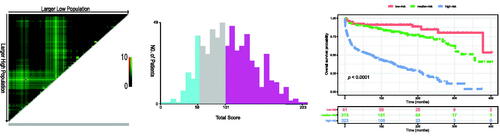
Figure 11. Cut-off values calculated by X-tile (A) and (B). Overall survival of all PLFGT patients stratified by risk (C).
Data availability statement
Publicly available datasets were analysed in this study. This data can be found in the SEER database (https://seer.cancer.gov/).