
Figures & data
Figure 1. Prisma flowchart with details of the article screening process.
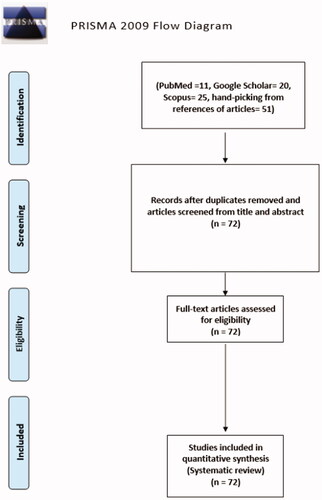
Table 1. Demographic characteristics of BTM patients with EMH.
Figure 2. Frequency of reported presenting features of EMH in BTM patients.
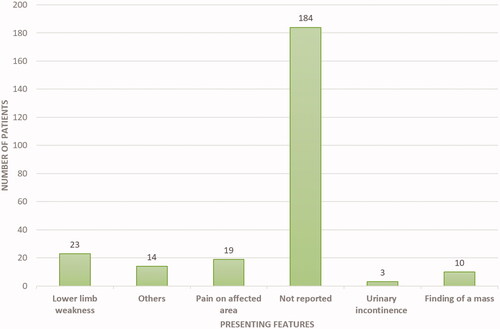
Table 2. Treatment lines among the patients with a reported outcome.
Figure 3. MRI spine: intraspinal epidural extramedullary masses T2 (lowered border) to T9 (arrows in A and B). Anterior displacement and compression of the cord in the thoracic spine is secondary to the compression by the EMH (arrow in C at T7 level) reaching upto the left neural foramen (arrow in D at T10 level). Note. Image taken from Clinical Case reports from a previously published article [Citation18]. The licence of the article (CC-BY) permits unrestricted reuse of the published work.
![Figure 3. MRI spine: intraspinal epidural extramedullary masses T2 (lowered border) to T9 (arrows in A and B). Anterior displacement and compression of the cord in the thoracic spine is secondary to the compression by the EMH (arrow in C at T7 level) reaching upto the left neural foramen (arrow in D at T10 level). Note. Image taken from Clinical Case reports from a previously published article [Citation18]. The licence of the article (CC-BY) permits unrestricted reuse of the published work.](/cms/asset/31e04fdb-7ec5-4d13-97fa-509496e54f87/iann_a_2048065_f0003_c.jpg)
Figure 4. MRI spine: (A) Sagittal T2 WI showing a diffuse low-signal intensity of the bone marrow of a well-defined isointense mass (5.3 × 3 cm) in the presacral region (blue arrow). A second mass (2 × 1 cm) in anterior extradural space posterior to S1 level (Blue arrow). (B) Mass enhancement seen in the axial postcontrast fat-saturated image at the presacral area (Blue arrow). (C) Axial postcontrast fat-saturated image at S1 level showing anterior extradural mass with slightly high signal intensity (blue arrow) at the midline, with displacement of the S1 nerve roots laterally. Note. Image taken from Clinical Case reports from a previously published article [Citation42]. The licence of the article (CC-BY) permits unrestricted reuse of the published work.
![Figure 4. MRI spine: (A) Sagittal T2 WI showing a diffuse low-signal intensity of the bone marrow of a well-defined isointense mass (5.3 × 3 cm) in the presacral region (blue arrow). A second mass (2 × 1 cm) in anterior extradural space posterior to S1 level (Blue arrow). (B) Mass enhancement seen in the axial postcontrast fat-saturated image at the presacral area (Blue arrow). (C) Axial postcontrast fat-saturated image at S1 level showing anterior extradural mass with slightly high signal intensity (blue arrow) at the midline, with displacement of the S1 nerve roots laterally. Note. Image taken from Clinical Case reports from a previously published article [Citation42]. The licence of the article (CC-BY) permits unrestricted reuse of the published work.](/cms/asset/ae0efa53-2cc7-4e6d-8651-c6fba0df0a7d/iann_a_2048065_f0004_c.jpg)
Figure 5. (A) Haematoxylin and eosin-stained slide showing lymphoid tissue comprising tiny lymphocytes with scattered megakaryocytes (arrows), and clusters of myeloid and erythroid cells (circled). (B) Immunohistochemical stain “CD61” highlighting the cytoplasm of megakaryocyte in brown chromogen. (C) Immunohistochemical stain “MPO”, highlighting the myeloid precursors. (D) Immunohistochemical stain “Hemoglobin A”, highlighting the erythroid precursors. Note. Image taken from Clinical Case reports from a previously published article [Citation42]. The licence of the article (CC-BY) permits unrestricted reuse of the published work.
![Figure 5. (A) Haematoxylin and eosin-stained slide showing lymphoid tissue comprising tiny lymphocytes with scattered megakaryocytes (arrows), and clusters of myeloid and erythroid cells (circled). (B) Immunohistochemical stain “CD61” highlighting the cytoplasm of megakaryocyte in brown chromogen. (C) Immunohistochemical stain “MPO”, highlighting the myeloid precursors. (D) Immunohistochemical stain “Hemoglobin A”, highlighting the erythroid precursors. Note. Image taken from Clinical Case reports from a previously published article [Citation42]. The licence of the article (CC-BY) permits unrestricted reuse of the published work.](/cms/asset/416724b2-88c9-4c63-9954-014719540030/iann_a_2048065_f0005_c.jpg)
Figure 6. The pathophysiology of EMH in BTM. Concept reused with permission from Yang et al. [Citation22].
![Figure 6. The pathophysiology of EMH in BTM. Concept reused with permission from Yang et al. [Citation22].](/cms/asset/551d6e7d-e246-4cd1-b3c3-9a8a94d8b0a1/iann_a_2048065_f0006_c.jpg)