
Figures & data
Table 1. Baseline characteristics.
Table 2. Tumour responses and survival.
Figure 1. Kaplan–Meier curve showing OS and PFS for the whole cohort of patients treated with programmed cell death protein-1 (PD-1)-targeted immunotherapy. (A) OS rates in patients with ICC receiving anti-PD-1 agents. (B) PFS rates in patients with ICC receiving anti-PD-1 agents.
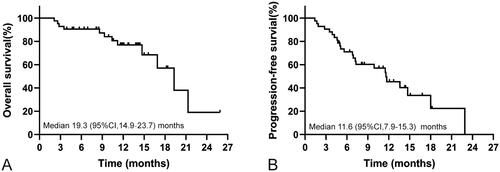
Figure 2. Kaplan–Meier curves showing OS and PFS for patients treated with PD-1-targeted immunotherapy according to radiological tumour response (partial response (PR)/stable disease (SD) vs. progressive disease (PD)). (A) OS rates in patients with or without disease progression. (B) PFS rates in patients with or without disease progression.
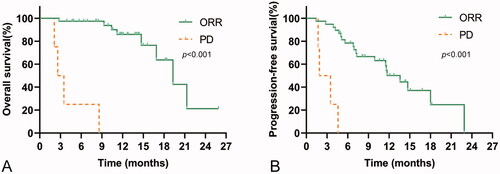
Figure 3. Kaplan–Meier curves showing OS and PFS for ICC patients treated with PD-1 monotherapy and PD-1 combination therapy. (A) OS rates in patients with PD-1 monotherapy and PD-1 combined with other treatments. (B) PFS rates in patients with PD-1 monotherapy and PD-1 combination therapy.
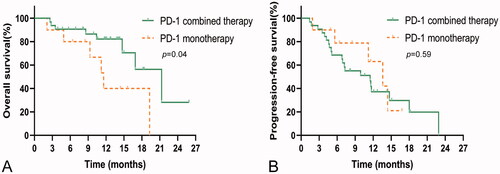
Table 3. Adverse events.
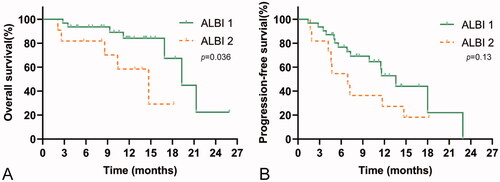
Figure 4. Kaplan–Meier curves showing OS and PFS for patients with different ALBI grades. (A) OS rates in patients with ALBI grade 1 and grade 2. (B) PFS rates in patients with ALBI grade 1 and grade 2.
Data availability statement
The data that support the findings of this study are available from the corresponding author.