
Figures & data
Figure 1. Enrolment criteria.
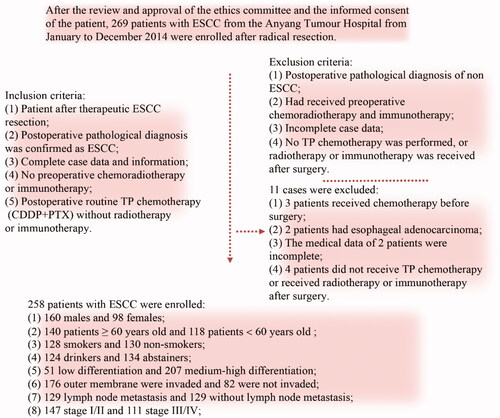
Figure 2. Fn infection, NLRP3 expression and MDSCs enrichment in ESCC tissues (×400). A/E/I: Fn infection was detected by RNAscope (16S rRNA); B/F/J: NLRP3 expression was detected by IHC; C/D/G/H/K/L: MDSCs infiltration (CD11b and CD33) was detected by IHC.
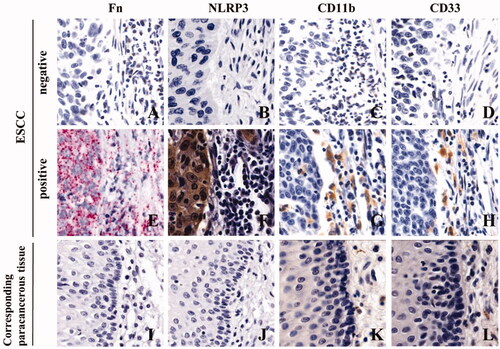
Table 1. Correlation analysis of various factors in ESCC cancer tissues and adjacent tissues.
Table 2. Consistency analysis of various factors in ESCC tissues.
Table 3. Correlations between Fn infection, high NLRP3 expression and MDSCs enrichment and the clinicopathological characteristics of ESCC patients [N (%)].
Figure 3. Kaplan–Meier survival curves of ESCC patients at 5 years after surgery. A: Five-year survival curve of patients with ESCC after surgery; B: Survival curves of patients with and without Fn infection; C: Survival curves of ESCC patients with and without NLRP3 expression; D: Survival curves of ESCC patients with and without MDSCs infiltration.
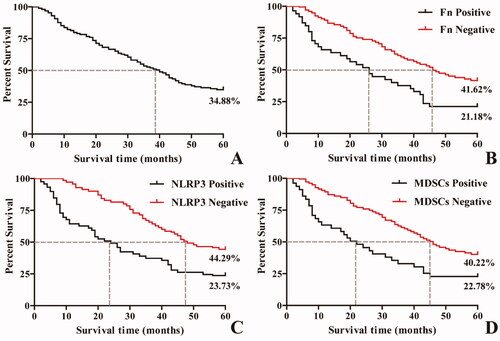
Table 4. Correlations of Fn infection, high NLRP3 expression and MDSCs enrichment with 5-year survival in ESCC patients.
Figure 4. Effects of Fn on the coculture system of human PBMCs and ESCC cells. A: Western blot was used to detect the expression of NLRP3 protein in each cell line; B: Differences in NLRP3 protein expression among the groups of cell lines; C: Dose–response curve of CDDP; D: Differences in CDDP IC50 values among the groups of cell lines; E: Leukocyte population (CD45+ cells); F: HLA-DR− Cell population; G: Differences in percentage of MDSCs (CD45+HLA-DR−CD11b+CD33+ cells) in each group; H: Flow cytometry of the percentage of MDSCs (CD45+HLA-DR−CD11b+CD33+ cells) in each group. 1) Compared with the Fn uninfected group, p < 0.05; 2) Compared with the control group, p < 0.05; 3) Compared with the KYSE150 group, p < 0.05; 4) Compared with the KYSE150 + Fn group, p < 0.05.
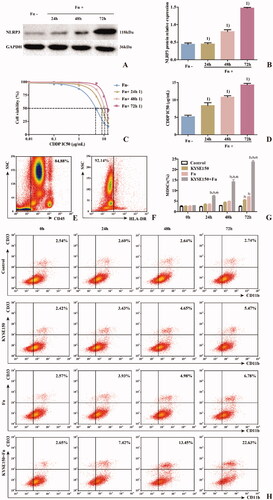
Figure 5. NLRP3 is a key regulatory factor of Fn-induced MDSCs enrichment and CDDP treatment resistance in ESCC. A: Western blot was used to detect the expression of NLRP3 protein in each cell line; B: Differences in NLRP3 protein expression among the groups of cell lines; C: Dose–response curve of CDDP; D: Differences in CDDP IC50 values among the groups of cell lines; E: Leukocyte population (CD45+ cells); F: HLA-DR− Cell population; G: Differences in percentage of MDSCs (CD45+HLA-DR−CD11b+CD33+ cells) in each group; H: Flow cytometry of the percentage of MDSCs (CD45+HLA-DR−CD11b+CD33+ cells) in each group; I: Scientific schematic diagram of CDDP inducing the death of tumour cells not infected by Fn; J: Scientific schematic diagram of the enrichment of MDSCs caused by Fn via the activation of NLRP3 in ESCC cells and resistance to CDDP treatment. 1) Compared with the KYSE150 group, p < 0.05, and 2) compared with the KYSE150 + Fn group, p < 0.05.
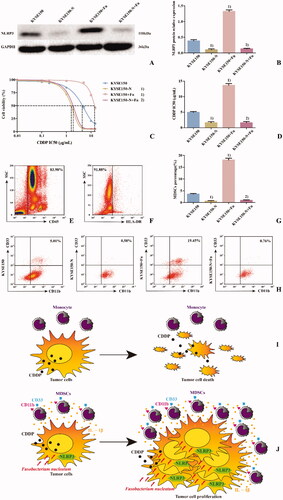
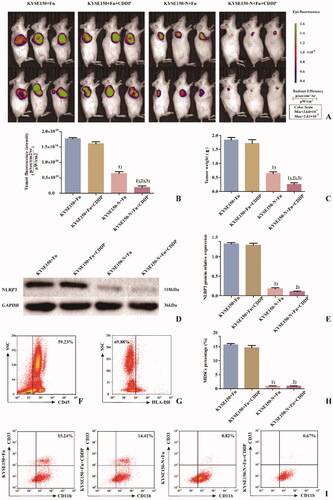
Figure 6. Effects of Fn infection and NLRP3 knockdown on CDDP treatment in NSG mice. A: Tumour size and fluorescence intensity of lesions from NSG mice in each group detected by in vivo imaging; B: Differences in tumour size and fluorescence intensity of NSG mice among the groups; C: Differences in tumour weight of NSG mice among the groups; D: Western blot was used to detect the expression of NLRP3 protein in tumours of NSG mice among the groups; E: Differences in NLRP3 protein expression in tumours of NSG mice among the groups; F: Leukocyte population (CD45+ cells); G: HLA-DR− Cell population; H: Differences in percentage of MDSCs (CD45+HLA-DR−CD11b+CD33+ cells) in tumours of NSG mice among the groups; I: Flow cytometry of the percentage of MDSCs (CD45+HLA-DR−CD11b+CD33+ cells) in tumours of NSG mice among the groups. 1) Compared with the KYSE150 + Fn group, p < 0.05; 2) compared with the KYSE150 + Fn + CDDP group, p < 0.05; 3) compared with the KYSE150-N + Fn group, p < 0.05.
Data availability statement
The data that support the findings of this study are available on request from the corresponding author. The data are not publicly available due to privacy or ethical restrictions.