
Figures & data
Figure 1. The schematic diagram for patient enrolment and delivery prediction by quantitative analysis of four steroid metabolites with an LC-MS/MS assay.
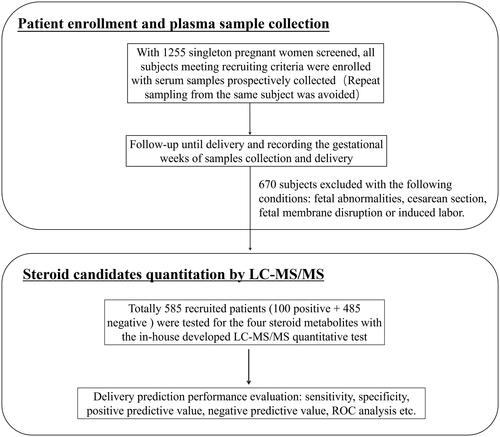
Table 1. Linearity, LLOQ and stability of the four steroid candidates in LC-MS/MS assay.
Table 2. Recoveries and imprecisions of the four steroid candidates in LC-MS/MS assay.
Table 3. Demographic data of enrolled subjects and plasma levels of the four steroid candidates.
Figure 2. Box plots representing the plasma levels of the four steroid candidates in positive and negative groups. (A) E3-16-Glu, oestriol-16-glucuronide; (B) THDOC, tetrahydrodeoxycorticosterone; (C) A-3,17-Diol, androstane-3,17-diol;(D) 17-OHP, 17-alpha-hydroxyprogesterone. *Indicates p < .001.
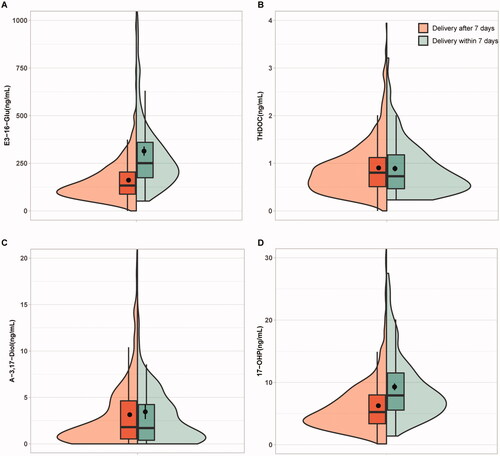
Figure 3. Performance assessment of the steroid candidates E3-16-Gluc and 17-OHP in delivery prediction by ROC analysis with or without gestational age adjustment. (A–C): ROC curves for E3-16-Gluc, 17-OHP, and combined testing (E3-16-Gluc and 17-OHP); (D–F): gestational age-adjusted ROC curves for E3-16-Gluc, 17-OHP, and combined testing (E3-16-Gluc and 17-OHP) respectively. AUC: area under the curve; AAUC: gestational age-adjusted AUC.
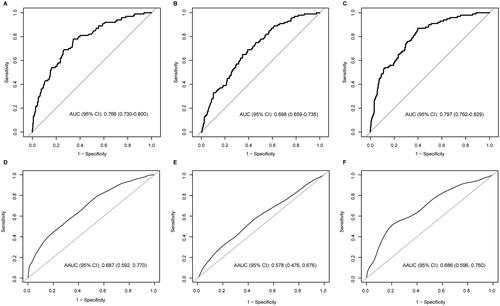
Table 4. Predictive performance of the four steroid candidates in asymptomatic pregnant women delivery.
Supplemental Material
Download Zip (2.2 MB)Data availability statement
The authors confirm that the data supporting the findings of this study are available within the article and its Supplemental materials.