
Figures & data
Table 1. Selection criteria for autologous stem cell transplantation.
Table 2. Baseline characteristics.
Table 3. Haematologic and organ responses.
Figure 1. (A) The OS of all patients. (B) The OS between patients who had total TBil ≥ 34.2 umol/L and TBil < 34.2 umol/L. (C) The OS between patients who had haematologic response and no haematologic response patients. (D) The OS between patients who had NT-ProBNP ≥ 1800 pg/ml and NT-ProBNP <1800 pg/ml.
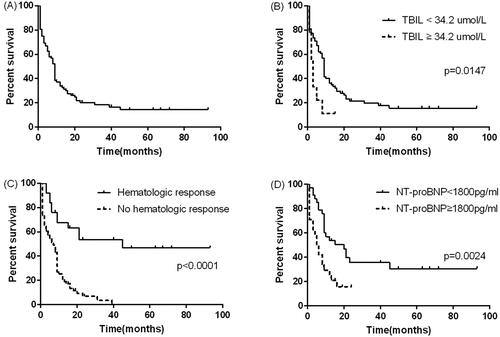
Table 4. Results of univariate and multivariate analysis for all-cause mortality.
Data availability statement
All data generated within this study are available from the corresponding author on request.