
Figures & data
Table 1. Name and a brief description of all variables (Population Determinants or PDs) used in the study.
Figure 1. Geospatial distribution of weekly slopes (number of cases per 10,000 people per day) of the COVID-19 spread curve from DAY1 (first day with a reported non-zero confirmed case): (A) at the end of the first week, (B) from the end of week 2 to the end of week 3, (C) from the end of week 5 to the end of week 6, and (D) from the end of week 7 to the end of week 8.
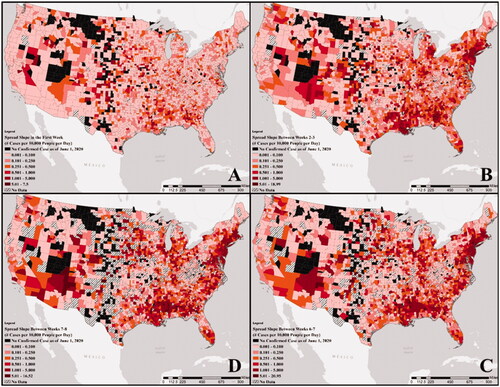
Figure 2. The longitudinal nationwide median of weekly slopes (number of cases per 10,000 people per day) using the normalized cases. The dashed lines represent the national median days since DAY1 for the issuance and lifting the stay-home order.
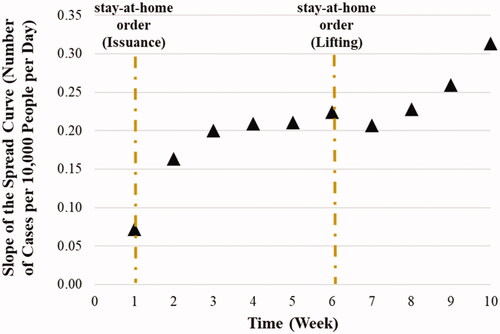
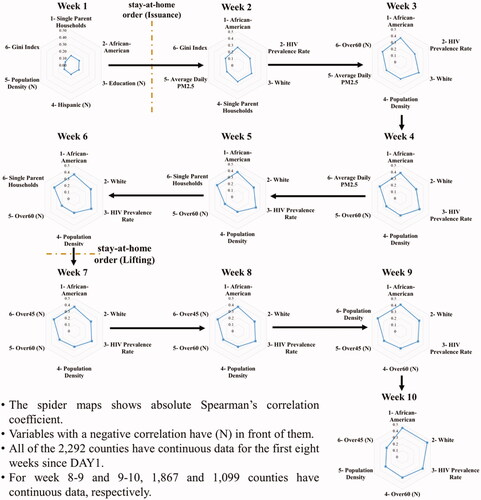
Figure 3. The top six most correlated PDs with the slope of the COVID-19 spread curve and corresponding Spearsman's correlation coefficients for different weeks.
Supplemental Material
Download MS Word (12.1 MB)Data availability statement
The authors confirm that the data supporting the findings of this study are available within the article and its supplementary materials.