
Figures & data
Table 1. Demographic data.
Figure 1. Comparison of OS by tumour entity. Heterogenity of included cancer subtype and influence on OS. HNSCC: Head and neck squamous cell carcinoma; Lung: lung cancer; Renal: renal cell carcinoma.
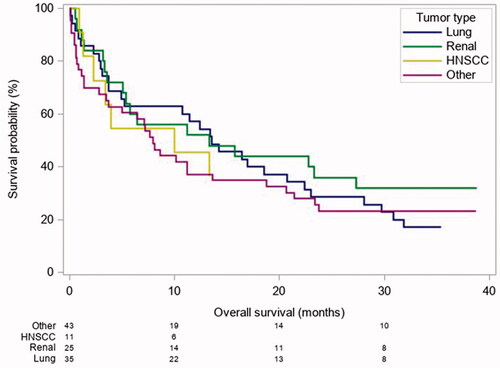
Figure 2. Pre-treatment serum levels and their unadjusted association with OS and PFS. (A) OS curve for LDH, (B) PFS for LDH, (C) OS curve for CRP, (D) PFS for CRP levels, (E) OS curve for serum Alb, (F) PFS curve for serum Alb, (G) OS curve for LC and (H) PFS curve for LC.
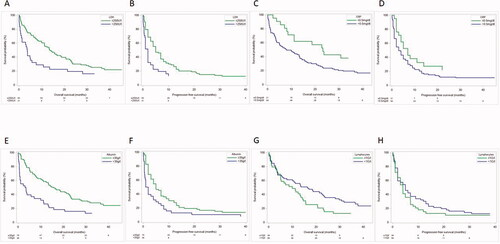
Table 2. Median OS and 25–75 percentile according to serum LDH, CRP, Alb and LC at therapy start.
Figure 3. Univariable and multivariable analysis of the effect of baseline covariable value on OS (A) and PFS (B). Hazard ratios (with 95% confidence intervals) quantify the effect resulting from a change in the respective baseline covariable value. Effects of covariables entering the model after log-transformation refer to 20% increases, those of other variables to increases by the given units. Time-dependent effects are reported at 6, 12 and 24 months. Confidence intervals not including 1 indicate statistical significance. Both, univariable and multivariable models are stratified for tumour type.
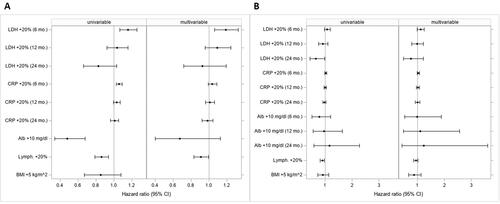
Figure 4. Different scores and their influence on outcome parameters in cancer patients. The GPS has prognostic value regarding OS (A) and PFS (B) in our cohort of patients undergoing ICI therapy. Neutrophil to lymphcyte Ratio is strongly prognostic regarding OS (C) and PFS (D) in our cohort of patients. GRIm Score has prognostic value regarding OS (E) and PFS (F) in our cohort of patients treated with ICIs.
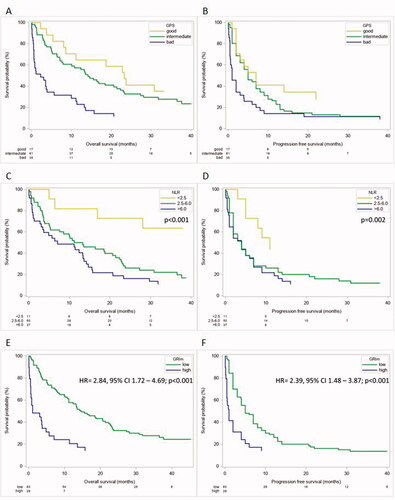
Table 3. Median OS and HR of predefined scores.
Figure 5. OS according to the individual 8-weeks change in LDH (A), CRP (B) and Alb (C) when grouped into quartiles 1–4 (Q1–Q4). Q1 representing the highest increase and Q4 the lowest increase of each serum parameter. p<.05 shows a statistically significant effect between all quartiles including a time dependent effect.
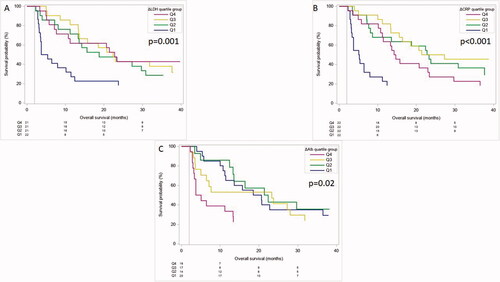
Table 4. Median OS and 25–75 percentile and HR and 95% CI for differences between baseline and 8 weeks regarding 6 month – OS for LDH, CRP and Alb.
Data availability statement
Data and materials supporting the results are available upon reasonable request from the corresponding author TF ([email protected])